Telemetry Issues
Issues related to the telemetry pipeline: Kafka, iDRAC telemetry, LDMS samplers, VictoriaMetrics (cluster mode), VictoriaLogs, and Grafana dashboards.
Kafka Pods CrashLoopBackOff
Symptom
Kafka pods enter CrashLoopBackOff state.
Cause
- No service kube nodes available.
- Missing CSI driver.
- Persistent volume full.
Resolution
- Ensure service kube nodes are booted.
- Add PowerScale CSI driver (see Missing PowerScale CSI Driver).
- Increase Kafka volume and configure log retention.
Kafka "No Space Left on Device"
Symptom
- New telemetry data is not being collected or forwarded to storage
- Telemetry dashboards show data gaps or stale metrics
- One or more kafka-broker pods are in CrashLoopBackOff state with repeated restarts
- Dependent pods such as idrac-telemetry show high restart counts or are unable to reach a ready state
- Services that produce or consume Kafka messages report connection or write failures
- Running
kubectl get pods -n telemetryshows the affected broker and telemetry pods
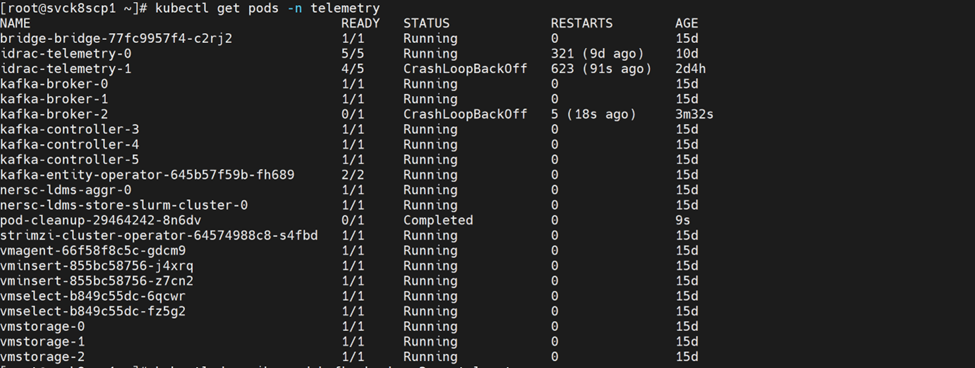
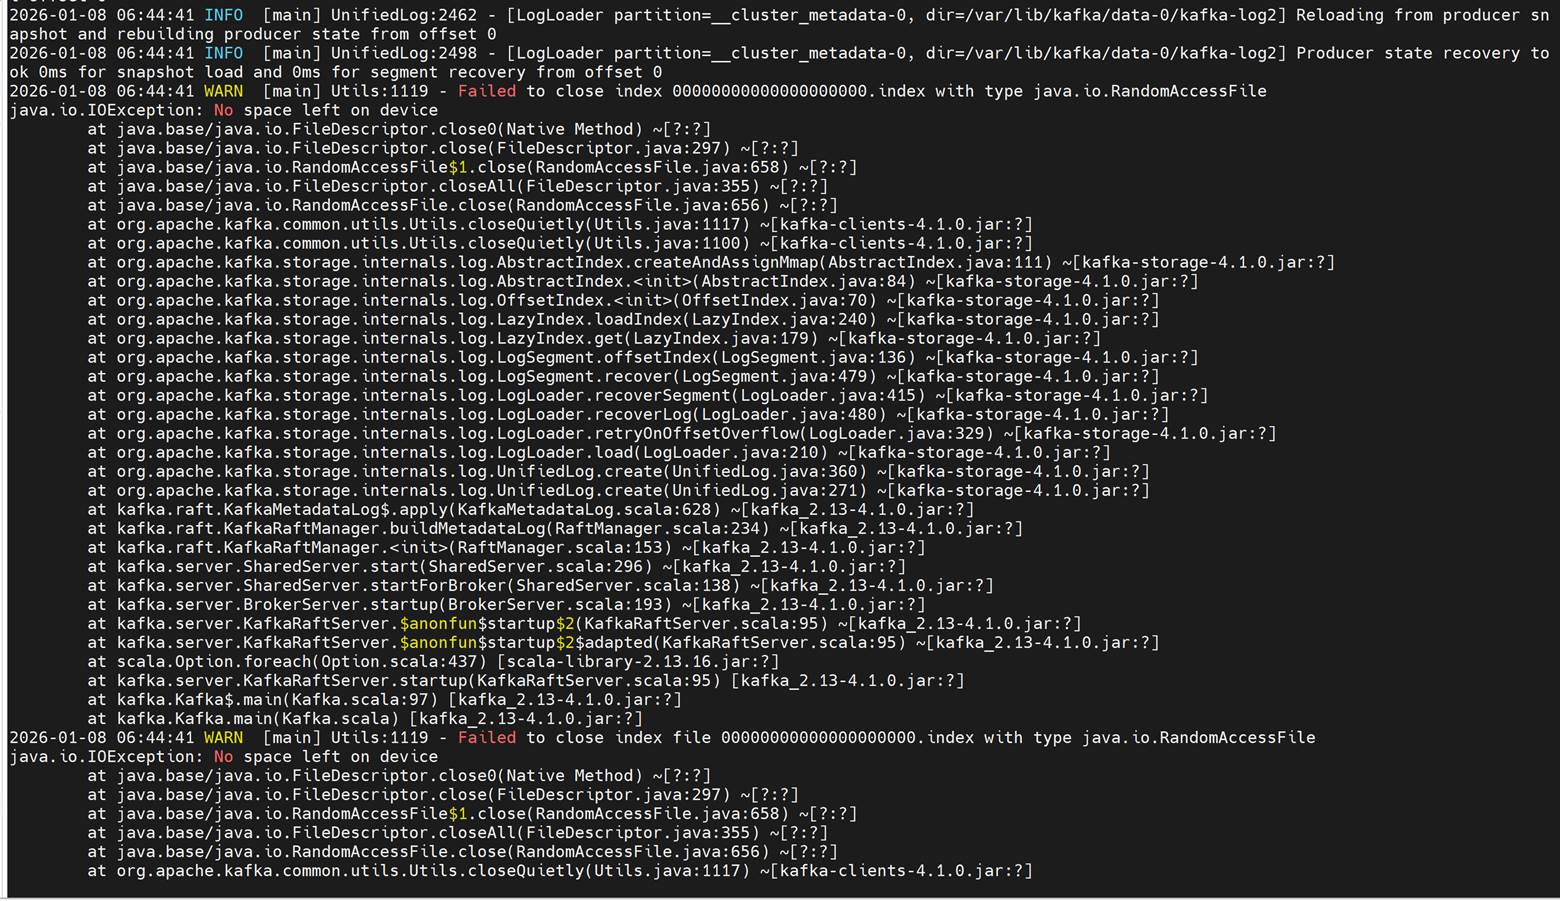
Inspecting the crashing Kafka broker logs reveals java.io.IOException: No space left on device errors:
Cause
Configured persistence_size for Kafka has reached capacity limit.
Resolution
The default 8Gi persistent volume size is suitable for small clusters (typically fewer than 5 nodes). For larger clusters, increase persistence_size and configure Kafka retention settings log_retention_hours and log_retention_bytes so that old logs are deleted before the persistent volume reaches its limit.
For Kafka PV sizing guidance based on telemetry sources and node count, see Kafka PV Sizing Guidance.
Emergency Cleanup Script
If Kafka brokers are experiencing disk space issues and require immediate cleanup, use the following automated script to identify and remove old log segments:
#!/bin/bash
# ============================================================
# KAFKA PV FULL — AUTOMATED EMERGENCY CLEANUP (OMNIA)
# ============================================================
set -e
NAMESPACE="telemetry"
BROKER_COUNT=3
RETENTION_MS=3600000        # 1 hour temporary retention
SEGMENT_AGE_DAYS=3          # Delete segments older than 3 days

echo "============================================"
echo " KAFKA PV EMERGENCY CLEANUP - AUTOMATED"
echo "============================================"

# -------------------------------------------------------
# STEP 1: CHECK — Which brokers are full
# -------------------------------------------------------
echo ""
echo ">>> STEP 1: Checking broker disk usage..."
BROKERS_HEALTHY=true
RESPONSIVE_BROKER=""
for i in $(seq 0 $((BROKER_COUNT-1))); do
  echo "=== kafka-broker-$i ==="
  POD_STATUS=$(kubectl get pod -n $NAMESPACE kafka-broker$i -o jsonpath='{.status.phase}')
  READY=$(kubectl get pod -n $NAMESPACE kafka-broker$i -o jsonpath='{.status.conditions[?(@.type=="Ready")].status}')
  echo "  Pod Phase: $POD_STATUS"
  echo "  Ready: $READY"
  if kubectl exec -n $NAMESPACE kafka-broker$i -- echo "OK" 2>/dev/null; then
    echo "  Broker-$i: RESPONSIVE"
    [ -z "$RESPONSIVE_BROKER" ] && RESPONSIVE_BROKER=$i
  else
    echo "  Broker-$i: NOT RESPONSIVE (exec failed)"
    BROKERS_HEALTHY=false
  fi
done

# -------------------------------------------------------
# DECISION: Brokers responsive → Exit (no action needed)
#           Brokers crashing   → Path B (manual cleanup)
# -------------------------------------------------------
if [ "$BROKERS_HEALTHY" = true ]; then
  echo ""
  echo "All brokers are running and responsive."
  echo "This script is designed for emergency cleanup when brokers are crashlooping or PVs are full."
  echo "Since all brokers are healthy, no action is needed."
  echo "Exiting without making changes."
  exit 0
fi
    echo ""
    echo "============================================"
    echo " PATH B: BROKERS CRASHLOOPING — MANUAL FIX"
    echo "============================================"

    # ----------------------------------------------------
    # STEP 2: Get PVC names
    # ----------------------------------------------------
    echo ""
    echo ">>> STEP 2: Detecting PVC names..."
    echo "  Listing all PVCs in $NAMESPACE namespace..."
    kubectl get pvc -n $NAMESPACE

    # Try to detect PVC prefix
    FIRST_PVC=$(kubectl get pvc -n $NAMESPACE -o jsonpath='{.items[0].metadata.name}' 2>/dev/null)
    if [ -z "$FIRST_PVC" ]; then
      echo "ERROR: No PVCs found in $NAMESPACE namespace"
      exit 1
    fi
    echo "First PVC: $FIRST_PVC"

    # Extract PVC prefix by removing the broker number suffix
    # Pattern: data-0-kafka-broker-0 -> data-0-kafka-broker
    PVC_PREFIX=$(echo "$FIRST_PVC" | sed 's/-[0-9]$//')
    echo "PVC prefix detected: $PVC_PREFIX"

    # Verify PVC names match expected pattern
    echo "Verifying PVC names match expected pattern..."
    for i in $(seq 0 $((BROKER_COUNT-1))); do
      EXPECTED_PVC="${PVC_PREFIX}-${i}"
      if kubectl get pvc -n $NAMESPACE "$EXPECTED_PVC" >/dev/null 2>&1; then
        echo "  $EXPECTED_PVC: FOUND"
      else
        echo "  $EXPECTED_PVC: NOT FOUND (will cause cleanup pod to fail)"
        echo "  Listing all PVCs again for reference:"
        kubectl get pvc -n $NAMESPACE
        echo "ERROR: PVC naming pattern doesn't match. Please check PVC names and update script."
        exit 1
      fi
    done

    # ----------------------------------------------------
    # STEP 2.5: Stop broker pods to release PVCs
    # ----------------------------------------------------
    echo ""
    echo ">>> STEP 2.5: Stopping broker pods to release PVCs..."

    # Check if Kafka is managed by StatefulSet
    if kubectl get statefulset -n $NAMESPACE kafka-broker >/dev/null 2>&1; then
      echo "  Kafka brokers managed by StatefulSet: kafka-broker"
      echo "  Scaling down to 0 replicas..."
      kubectl scale statefulset -n $NAMESPACE kafka-broker --replicas=0
      echo "  Waiting for pods to terminate..."
      kubectl wait -n $NAMESPACE --for=delete pod/kafka-broker-0 --timeout=120s --ignore-not-found || true
      kubectl wait -n $NAMESPACE --for=delete pod/kafka-broker-1 --timeout=120s --ignore-not-found || true
      kubectl wait -n $NAMESPACE --for=delete pod/kafka-broker-2 --timeout=120s --ignore-not-found || true
    else
      echo "  Kafka brokers not managed by StatefulSet, deleting pods directly..."
      for i in $(seq 0 $((BROKER_COUNT-1))); do
        echo "  Deleting kafka-broker-$i..."
        kubectl delete pod -n $NAMESPACE kafka-broker$i --ignore-not-found --force --grace-period=0
      done
      echo "  Waiting for broker pods to terminate..."
      for i in $(seq 0 $((BROKER_COUNT-1))); do
        kubectl wait -n $NAMESPACE --for=delete pod/kafka-broker$i --timeout=60s || true
      done
    fi

    # ----------------------------------------------------
    # STEP 2.6: Cleanup any existing cleanup pods
    # ----------------------------------------------------
    echo ""
    echo ">>> STEP 2.6: Removing any existing cleanup pods..."
    for i in $(seq 0 $((BROKER_COUNT-1))); do
      kubectl delete pod -n $NAMESPACE kafka-cleanup$i --ignore-not-found
    done
    echo "  Waiting for cleanup pods to be removed..."
    sleep 5

    # ----------------------------------------------------
    # STEP 3: Deploy cleanup pods
    # ----------------------------------------------------
    echo ""
    echo ">>> STEP 3: Deploying cleanup pods..."
    for i in $(seq 0 $((BROKER_COUNT-1))); do
      PVC_NAME="${PVC_PREFIX}-${i}"
      echo "  Creating cleanup pod for PVC: $PVC_NAME"
      kubectl run kafka-cleanup-$i -n $NAMESPACE \
        --image=busybox \
        --restart=Never \
        --overrides='{
          "spec": {
            "containers": [{
              "name": "cleanup",
              "image": "busybox",
              "command": ["sh","-c","sleep 3600"],
              "volumeMounts": [{
                "name": "data",
                "mountPath": "/data"
              }]
            }],
            "volumes": [{
              "name": "data",
              "persistentVolumeClaim": {
                "claimName": "'$PVC_NAME'"
              }
            }]
          }
        }'
    done

    echo "  Waiting for cleanup pods..."
    for i in $(seq 0 $((BROKER_COUNT-1))); do
      echo "  Waiting for kafka-cleanup-$i..."
      if ! kubectl wait -n $NAMESPACE --for=condition=Ready pod/kafka-cleanup$i --timeout=120s; then
        echo "  ERROR: kafka-cleanup-$i failed to become Ready"
        echo "  Pod status:"
        kubectl get pod -n $NAMESPACE kafka-cleanup$i -o wide
        echo "  Pod events:"
        kubectl describe pod -n $NAMESPACE kafka-cleanup$i --tail=20
        exit 1
      fi
    done

    # ----------------------------------------------------
    # STEP 4: Show current usage + Clean old segments
    # ----------------------------------------------------
    echo ""
    echo ">>> STEP 4: Cleaning old segments (>${SEGMENT_AGE_DAYS} days)..."
    for i in $(seq 0 $((BROKER_COUNT-1))); do
      echo "=== kafka-broker-$i (BEFORE) ==="
      kubectl exec -n $NAMESPACE kafka-cleanup$i -- df -h /data

      # Detect actual data directory within PVC mount
      echo "  Detecting data directory within PVC..."
      PVC_DATA_DIR=$(kubectl exec -n $NAMESPACE kafka-cleanup$i -- \
        sh -c 'find /data -type d -name "*.log" 2>/dev/null | head -1 | xargs dirname 2>/dev/null || echo "/data"' 2>/dev/null)
      if [ "$PVC_DATA_DIR" = "/data" ]; then
        # Try common subdirectories
        for SUBDIR in "kafka-log0" "kraft-combined-logs" "data"; do
          if kubectl exec -n $NAMESPACE kafka-cleanup$i -- sh -c "test -d /data/$SUBDIR && echo /data/$SUBDIR" 2>/dev/null | grep -q .; then
            PVC_DATA_DIR="/data/$SUBDIR"
            break
          fi
        done
      fi
      echo "  Using data directory: $PVC_DATA_DIR"

      echo "  Cleaning..."
      DELETED=$(kubectl exec -n $NAMESPACE kafka-cleanup$i -- \
        sh -c 'count=0; find '"$PVC_DATA_DIR"' -name "*.log" -mtime +'"$SEGMENT_AGE_DAYS"' 2>/dev/null | while read f; do
          base=$(echo "$f" | sed "s/\.log$//")
          rm -f "${base}.log" "${base}.index" "${base}.timeindex" "${base}.snapshot"
          count=$((count+1))
          echo "$count"
        done | tail -1')
      echo "  Broker-$i: Deleted ${DELETED:-0} segments"
    done

    # ----------------------------------------------------
    # STEP 5: Verify space recovered
    # ----------------------------------------------------
    echo ""
    echo ">>> STEP 5: Verifying space recovered..."
    for i in $(seq 0 $((BROKER_COUNT-1))); do
      echo "=== kafka-broker-$i (AFTER) ==="
      kubectl exec -n $NAMESPACE kafka-cleanup$i -- df -h /data
    done

    # ----------------------------------------------------
    # STEP 6: Remove cleanup pods
    # ----------------------------------------------------
    echo ""
    echo ">>> STEP 6: Removing cleanup pods..."
    for i in $(seq 0 $((BROKER_COUNT-1))); do
      kubectl delete pod -n $NAMESPACE kafka-cleanup$i --ignore-not-found
    done

    # ----------------------------------------------------
    # STEP 7: Scale up StatefulSet to restore brokers
    # ----------------------------------------------------
    echo ""
    echo ">>> STEP 7: Scaling up StatefulSet to restore brokers..."
    if kubectl get statefulset -n $NAMESPACE kafka-broker >/dev/null 2>&1; then
      echo "  Scaling kafka-broker StatefulSet to $BROKER_COUNT replicas..."
      kubectl scale statefulset -n $NAMESPACE kafka-broker --replicas=$BROKER_COUNT
      echo "  Waiting for brokers to become ready..."
      for i in $(seq 0 $((BROKER_COUNT-1))); do
        kubectl wait -n $NAMESPACE --for=condition=Ready pod/kafka-broker$i --timeout=300s
        echo "  kafka-broker-$i is ready. Stabilizing..."
        sleep 60
      done
    else
      echo "  StatefulSet not found, brokers should auto-restart from Deployment"
      sleep 120
    fi

  echo ""
  echo "============================================"
  echo " CLEANUP COMPLETE"
  echo "============================================"
  echo ""
  echo ">>> Final disk usage:"
  for i in $(seq 0 $((BROKER_COUNT-1))); do
    echo "=== kafka-broker-$i ==="
    kubectl exec -n $NAMESPACE kafka-broker$i -- df -h /var/lib/kafka/data-0 2>/dev/null || echo "  Still recovering..."
  done
Script Usage
-
Save the script:
Run on: OIM hostvi kafka-pv-cleanup.sh -
Make the script executable:
Run on: OIM hostchmod +x kafka-pv-cleanup.sh -
Run the script:
Run on: OIM host./kafka-pv-cleanup.sh
Note
This script automatically detects whether brokers are responsive or crashlooping and applies the appropriate cleanup strategy. Modify the BROKER_COUNT, RETENTION_MS, and SEGMENT_AGE_DAYS variables at the top of the script to match your environment requirements.
LDMS Metrics Missing
Symptom
LDMS metrics do not appear in the telemetry dashboard or are missing expected data points.
Cause
- LDMS aggregator pods are not running or experiencing errors.
- LDMS store daemon service is inactive.
- LDMS sampler service is not functioning correctly.
Resolution
The LDMS data pipeline consists of three stages. Diagnose each stage in the following order:
Data Flow: Sampler (compute nodes, port 10001) → Aggregator pod (nersc-ldms-aggr-0) → Store pod (nersc-ldms-store-slurm-cluster-0) → Kafka ldms topic
-
Verify LDMS sampler on compute nodes
On each Slurm/compute node, check the sampler service:
Run on: compute nodesudo systemctl status ldmsd.sampler.serviceIf the service is inactive or failed, restart and enable it:
Run on: compute nodesudo systemctl restart ldmsd.sampler.service sudo systemctl enable ldmsd.sampler.serviceVerify the sampler is producing metric sets locally:
Run on: compute node/opt/ovis-ldms/sbin/ldms_ls -x sock -h localhost -p 10001 -a ovisExpected output: a list of metric sets such as
<hostname>/meminfo,<hostname>/vmstat,<hostname>/loadavg,<hostname>/procstat2,<hostname>/procnetdev2.To view detailed metric values:
Run on: compute node/opt/ovis-ldms/sbin/ldms_ls -x sock -h localhost -p 10001 -a ovis -lIf no metric sets are listed, check the sampler configuration and service logs:
Run on: compute nodecat /opt/ovis-ldms/etc/ldms/sampler.conf journalctl -u ldmsd.sampler.service --no-pager -n 50 -
Verify LDMS aggregator pod
Check the aggregator pod status:
Run on: K8s control planekubectl get pods -n telemetry | grep ldms-aggrIf the pod is not in Running state, inspect pod events:
Run on: K8s control planekubectl describe pod -n telemetry nersc-ldms-aggr-0Check aggregator logs for connectivity errors:
Run on: K8s control planekubectl logs -n telemetry nersc-ldms-aggr-0 --tail=50Verify the aggregator is receiving metric sets from all producers:
Run on: K8s control planekubectl exec -n telemetry nersc-ldms-aggr-0 -- bash -c 'source /ldms_conf/ldms-env.nersc-ldms-aggr.slurm-cluster-0.sh && /ldms_bin/ldms_ls.bash'Expected output includes a JSON summary with TotalSets matching the number of metric schemas multiplied by the number of nodes (for example, 5 schemas × 2 nodes = 10 total sets).
Check producer connection status to verify all nodes show CONNECTED:
Run on: K8s control planekubectl exec -n telemetry nersc-ldms-aggr-0 -- bash -c 'source /ldms_conf/ldms-env.nersc-ldms-aggr.slurm-cluster-0.sh && /opt/ovis-ldms/bin/ldmsd_controller -a ${LDMSD_AUTH_PLUGIN} -A ${LDMSD_AUTH_OPTION} -x sock -h ${LDMSD_HOST} -p ${LDMSD_PORT} --cmd prdcr_status'If a producer shows DISCONNECTED, verify the sampler service is running on that compute node (step 1) and that port 10001 is reachable from the aggregator pod.
To restart the aggregator pod:
Run on: K8s control planekubectl delete pod -n telemetry nersc-ldms-aggr-0The StatefulSet controller will automatically recreate the pod.
-
Verify LDMS store daemon pod
Check the store pod status:
Run on: K8s control planekubectl get pods -n telemetry | grep ldms-storeCheck store logs for Kafka connectivity or storage errors:
Run on: K8s control planekubectl logs -n telemetry nersc-ldms-store-slurm-cluster-0 --tail=50Verify store daemon health and Kafka storage policy status:
Run on: K8s control planekubectl exec -n telemetry nersc-ldms-store-slurm-cluster-0 -- bash -c 'source /ldms_conf/ldms-env.nersc-ldms-store-slurm-cluster-0.sh && /ldms_bin/ldms_stats.bash'In the output, confirm:
- Daemon State: ready
- strgp_status shows the kafka storage policy in RUNNING state
- prdcr_stats shows connected_count equal to 1 (connected to aggregator)
If the store pod is failing to write to Kafka, verify the Kafka mTLS certificates are mounted:
Run on: K8s control planekubectl exec -n telemetry nersc-ldms-store-slurm-cluster-0 -- ls -la /ldms_certs/Expected files: ca.crt, user.crt, user.key.
To restart the store pod:
Run on: K8s control planekubectl delete pod -n telemetry nersc-ldms-store-slurm-cluster-0 -
Verify Kafka topic is receiving LDMS messages
Confirm the ldms Kafka topic exists:
Run on: K8s control planekubectl exec -n telemetry kafka-broker-0 -- /opt/kafka/bin/kafka-topics.sh --describe --topic ldms --bootstrap-server kafka-kafka-bootstrap.telemetry.svc.cluster.local:9092If the ldms topic does not exist, the store daemon has not connected successfully — review step 3.
Note
After fixing any component, allow 1–2 minutes for the pipeline to stabilize before checking the telemetry dashboard for new metrics.
iDRAC Telemetry — No Metrics Reaching VictoriaMetrics / Kafka
Symptom
iDRAC metrics (power, thermal, fan, CPU) do not appear in Grafana or VictoriaMetrics, or data is stale. The iDRAC telemetry receiver pods restart repeatedly or remain in 0/1 Ready state. New nodes do not appear as telemetry sources after provisioning.
Example errors in VictoriaPump / KafkaPump container logs:
ERROR failed to subscribe to Redfish event service: 401 UnauthorizedERROR redfish: event subscription rejected (SubscriptionLimitExceeded)WARN activemq: connection refused tcp 127.0.0.1:61616ERROR victoriapump: post to vmagent failed: dial tcp <vmagent-svc>:8429: connect: connection refused
Note
The 401 Unauthorized error may occur due to credential drift — when iDRAC credentials are changed on the iDRAC side after a successful deployment. Omnia stores credentials in mysqldb at insert-time and does not continuously re-validate them against the iDRAC appliance.
Cause
- Incorrect or expired iDRAC credentials in the vault (
idrac_username/idrac_password), resulting in401 Unauthorizederrors. - Redfish subscription limit reached on iDRAC (stale subscriptions from prior runs).
- iDRAC firmware does not support Redfish Telemetry/EventService.
- Pipeline component failure (ActiveMQ, KafkaPump, or VictoriaPump not ready).
- Collection type misconfiguration (
telemetry_sources.idrac.collection_targetsdoes not include the expected sink). - Network or firewall blocking OIM from reaching iDRAC on port 443, or receiver from reaching vmagent for scraping
victoria-pump:2112/metricsor Kafka on port 9093 (TLS).
Resolution
Diagnostics:
kubectl get pods -A | grep -Ei 'telemetry|idrac|victoria|kafka'
Inspect iDRAC telemetry receiver pod (contains mysqldb, activemq, idrac-telemetry-receiver, kafka-pump, victoria-pump, plus initContainer cleanup-mysql-locks):
kubectl -n telemetry describe pod <idrac-telemetry-pod>
kubectl -n telemetry logs <idrac-telemetry-pod> -c victoria-pump --tail=100
kubectl -n telemetry logs <idrac-telemetry-pod> -c kafka-pump --tail=100
Verify Redfish reachability and credentials:
curl -sk -u "$IDRAC_USER:$IDRAC_PASS" https://<idrac-ip>/redfish/v1/EventService | head
List and delete stale Redfish subscriptions:
curl -sk -u "$IDRAC_USER:$IDRAC_PASS" https://<idrac-ip>/redfish/v1/EventService/Subscriptions
Confirm metrics landed in VictoriaMetrics:
curl -s 'https://<vmselect-svc>:8481/select/0/prometheus/api/v1/query?query=up' | head
Resolution steps:
- Correct
idrac_username/idrac_passwordinomnia_config_credentials.yml, then runansible-playbook provision/provision.yml, SSH to kube_vip and manually re-runbash <k8s_client_mount_path>/telemetry/telemetry.sh, then runtelemetry.yml. Verify with the curl command above (expect 200). - Delete orphaned Redfish subscriptions using
curl -X DELETE ..., then allow the receiver to re-subscribe. - Update iDRAC firmware to a version that supports Redfish EventService/Telemetry, then re-run telemetry.
- If ActiveMQ/KafkaPump/VictoriaPump is unhealthy, check container logs and restart the receiver pod (
kubectl delete pod <pod>) after confirming the root cause. - Set
telemetry_sources.idrac.collection_targetsto["victoria_metrics"],["kafka"], or["victoria_metrics", "kafka"]to match where you expect data, then runansible-playbook provision/provision.yml, SSH to kube_vip and re-runbash <k8s_client_mount_path>/telemetry/telemetry.sh, then runtelemetry.yml. - Ensure OIM can reach iDRAC on port 443 and the receiver can reach vmagent for scraping
victoria-pump:2112/metricsand Kafka on port 9093 (TLS).
Note
iDRAC telemetry is enabled by telemetry_sources.idrac.metrics_enabled: true and routed per telemetry_sources.idrac.collection_targets in input/telemetry_config.yml. The receiver (mysqldb + activemq + idrac-telemetry-receiver + kafka-pump conditional + victoria-pump conditional, plus initContainer cleanup-mysql-locks) is a generated StatefulSet — modify inputs and re-run rather than editing the pod. Manifests (VMCluster, VLCluster, Kafka, iDRAC StatefulSet) are generated by provision.yml into telemetry/deployments/ on the NFS share, then applied by telemetry.sh, which cloud-init runs automatically only when a new control-plane node is provisioned. For an already-running cluster, after editing telemetry_config.yml, run ansible-playbook provision/provision.yml, SSH to kube_vip and manually re-run bash <k8s_client_mount_path>/telemetry/telemetry.sh, then run telemetry.yml only if the change involves iDRAC (credentials, collection_targets, BMC list).
VictoriaMetrics (Cluster Mode) — Pods Down, PVC Full, or Queries Failing
Symptom
One or more vmstorage, vminsert, or vmselect pods are in CrashLoopBackOff, Pending, or Evicted state. Recent samples are missing while older data is present (ingestion lag).
Omnia deploys VictoriaMetrics in cluster mode with TLS: vmstorage (3 replicas), vminsert (2), vmselect (2), and vmagent (2), with replication factor 2.
Example errors:
vmstorage:
panic: cannot open storage at "/storage": no space left on device
vminsert:
cannot send data to vmstorage node "vmstorage-1:8400": connection timed out
vmselect:
error during search: cannot fetch data from vmstorage nodes: not enough healthy storage nodes (got 1, need 2)
Pod events:
0/3 nodes are available: 3 Insufficient memory.Pod ephemeral local storage usage exceeds the total limit of containers
Cause
- vmstorage PVC is full (retention or ingest volume exceeded the provisioned storage)
- Insufficient healthy replicas (with replication factor 2, losing 2+ vmstorage pods prevents vmselect from satisfying reads)
- Resource pressure (pods Pending or Evicted due to insufficient memory or node disk pressure)
- TLS or certificate mismatch (expired or mismatched certificates between vminsert/vmselect and vmstorage break inter-component communication)
- vmagent backlog (vmagent cannot reach vminsert, queues fill, and remote_write stalls)
Resolution
Check pod and PVC status:
kubectl -n telemetry get pods -l 'app.kubernetes.io/name in (vmstorage,vminsert,vmselect,vmagent)' -o wide
kubectl -n telemetry get pvc | grep -i vmstorage
kubectl -n telemetry describe pod <vmstorage-pod> | sed -n '/Events/,$p'
Check disk usage inside a vmstorage pod:
kubectl -n telemetry exec <vmstorage-pod> -- df -h /storage
Check cluster health logs:
kubectl -n telemetry logs <vminsert-pod> --tail=100
kubectl -n telemetry logs <vmselect-pod> --tail=100
Check vmagent remote_write health (look for failed batches or queue size):
kubectl -n telemetry logs <vmagent-pod> --tail=100 | grep -Ei 'remote_write|error|drop'
Resolution Steps
-
Expand the vmstorage PVC (if the StorageClass allows allowVolumeExpansion) or reduce retention. In Omnia, set retention and sizing through the telemetry input config, then run
ansible-playbook provision/provision.yml, SSH to kube_vip and manually re-runbash <k8s_client_mount_path>/telemetry/telemetry.sh; do not manually edit the StatefulSet. -
Restore quorum by bringing failed vmstorage pods back (resolve node disk pressure or memory issues), confirming vmselect reports enough healthy nodes.
-
Free node resources or adjust requests/limits via the input config; reschedule Evicted pods.
-
Regenerate or rotate the telemetry certificates via the playbook so vminsert/vmselect ↔ vmstorage mTLS matches.
-
Once vminsert is reachable, vmagent flushes its queue; verify lag closes via a recent-range query.
Sizing guidance: provision vmstorage capacity from sources × active series/node × samples/series × retention. Under-provisioning the PVC is the most common cause of this issue — size for peak source count (iDRAC + LDMS + DCGM + PowerScale + UFM + VAST + OME), not initial node count.
Note
cluster mode, replica counts, replication factor, TLS, and retention are rendered from input/telemetry_config.yml and input/service_k8s.json. Modify inputs and re-run; pod edits are transient.
VictoriaLogs (Cluster Mode) — Logs Missing or Unsearchable
Symptom
Users cannot search or analyze historical syslog because LogsQL queries return no or stale results. Real-time log monitoring is broken, new events are lost. vlinsert, vlstorage, vlselect, or vlagent pods are unavailable. Slow response times, potential data loss during spikes.
Example errors:
- vlstorage: no space left on device
- vlinsert: cannot proxy request to vlstorage
- vlselect: some vlstorage nodes are unavailable
- vlagent: remote write failed
Cause
- vlstorage PVC is full
- One or more vlstorage pods are unavailable
- vlagent cannot forward logs to vlinsert
- Syslog sources are not forwarding logs to VLAgent
- Incorrect DNS, firewall, or TLS configuration between VictoriaLogs components
Resolution
-
Check VictoriaLogs health
Run on: K8s control planekubectl -n telemetry get pods | grep -E 'vlagent|vlinsert|vlstorage|vlselect' kubectl -n telemetry get pvc | grep vlstorage -
Recover a full vlstorage PVC
Check disk usage on each vlstorage pod:
Run on: K8s control planekubectl -n telemetry exec vlstorage-victoria-logs-cluster-0 -- df -h kubectl -n telemetry exec vlstorage-victoria-logs-cluster-1 -- df -h kubectl -n telemetry exec vlstorage-victoria-logs-cluster-2 -- df -hIncrease storage in input/telemetry_storage_config.yml or reduce retention in input/telemetry_config.yml, then redeploy:
Run on: OIM hostansible-playbook provision/provision.ymlRun on: K8s control planessh <kube_control_plane> ./<k8s_client_mount_path>/telemetry/telemetry.sh -
Recover unavailable storage pods
Diagnose pod issues:
Run on: K8s control planekubectl -n telemetry describe pod vlstorage-victoria-logs-cluster-0 kubectl -n telemetry describe pod vlstorage-victoria-logs-cluster-1 kubectl -n telemetry describe pod vlstorage-victoria-logs-cluster-2Check node health:
Run on: K8s control planekubectl get nodes kubectl describe node <node-name>Delete stuck pod (StatefulSet will recreate it):
Run on: K8s control planekubectl -n telemetry delete pod <vlstorage pod>Watch recreation:
Run on: K8s control planekubectl -n telemetry get pods -l app.kubernetes.io/component=vlstorage -w -
Verify VLAgent forwarding
Run on: K8s control planeNAMESPACE=telemetry echo -e "\n=== Test Connectivity ===" kubectl exec -n $NAMESPACE vlagent-vlagent-0 -- nc -vz vlinsert-victoria-logs-cluster 9481 2>&1 echo -e "\n=== VLInsert Logs ===" VLINSERT_POD=$(kubectl get pods -n $NAMESPACE -o name | grep vlinsert | head -1) if [ -n "$VLINSERT_POD" ]; then kubectl logs -n $NAMESPACE $VLINSERT_POD --tail=20 else echo "No vlinsert pods found" fi echo -e "\n=== VLStorage Disk Usage ===" kubectl exec -n $NAMESPACE vlstorage-victoria-logs-cluster-0 -- df -h /vlstorage-data echo -e "\n=== Query Recent Logs (HTTPS) ===" VLSELECT_IP=$(kubectl get svc -n $NAMESPACE vlselect-victoria-logs-cluster \ -o jsonpath='{.status.loadBalancer.ingress[0].ip}') if [ -n "$VLSELECT_IP" ]; then echo "Querying via LoadBalancer: $VLSELECT_IP" curl -k "https://${VLSELECT_IP}:9471/select/logsql/query?query=_time:5m&limit=5" else echo "No LoadBalancer IP, using port-forward..." fi -
Ensure the device or service is configured to emit syslog to VLAgent
Configure syslog forwarding for your specific device or service:
Telemetry Failover Delay After Kubernetes Worker Node Failure
Symptom
When a Kubernetes worker node fails, affected telemetry services take time to fail over to available worker nodes.
Resolution
No manual intervention is required. Wait for the telemetry services to recover and fail over automatically. Do not restart pods or nodes during this period, as it may extend recovery time.
Info
- Setup Telemetry -- Telemetry pipeline setup.
- Verify Telemetry -- Verification procedures.
- Log Management -- Log locations for telemetry services.