Configure Deployment Required for PowerScale Telemetry
Using Omnia, you can deploy PowerScale Telemetry to collect storage performance metrics and logs from Dell PowerScale storage nodes. The deployment includes configuring PowerScale Telemetry components on the service Kubernetes cluster, integrating with Dell CSM Metrics for PowerScale with an OpenTelemetry Collector, and ingesting logs via the syslog pipeline.
PowerScale Telemetry collects storage performance metrics and logs. PowerScale Telemetry includes these components:
CSM Metrics for PowerScale: Queries the OneFS API and emits metrics to an OpenTelemetry Collector.
OpenTelemetry Collector: Receives metrics from CSM Metrics and exposes a Prometheus endpoint for scraping.
vmagent: Scrapes the OpenTelemetry Collector Prometheus endpoint over TLS and forwards metrics to VictoriaMetrics.
VLAgent: Receives PowerScale syslog events and forwards them to VictoriaLogs.
CSI Driver for Dell PowerScale: Required for Omnia-orchestrated deployment mode.
cert-manager: Required for TLS certificate management in Omnia-orchestrated mode.
Supported Metrics and Logs
Metrics:
The PowerScale metrics include the following:
Performance: Protocol-level IOPS (NFS, SMB, S3), throughput (bytes/s), read/write latency
Capacity: Total cluster capacity, used capacity, available capacity, per-node capacity
Health: Node online/offline status, disk health, cluster rebalance status, protection group status
Topology: Cluster node membership, node roles, interconnect layout, protection domain mapping
For more details on PowerScale metrics, see Supported PowerScale Metrics
Logs
The PowerScale logs include the following:
Capacity warnings, disk failures, node state changes, protocol errors
Events are labeled with host/cluster, severity, and facility
Prerequisites
Ensure that the
provision.ymlplaybook has been executed successfully withservice_kube_control_planeandservice_kube_nodein the mapping file.For Omnia-orchestrated mode, ensure the service Kubernetes cluster has sufficient resources to run CSM Metrics, OpenTelemetry Collector, CSI Driver, and cert-manager.
For operator-provided mode, ensure the external OpenTelemetry Collector endpoint is accessible from the service cluster over TLS.
Ensure network connectivity between the PowerScale cluster and the Omnia log agent for syslog integration.
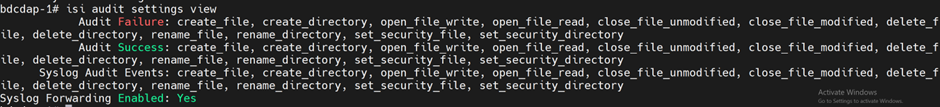
For PowerScale log collection, configure the following settings on the PowerScale cluster:
Enable syslog forwarding from PowerScale to Omnia using the following command:
isi audit setting modify --syslog-forwarding-enabled true
Note
To disable syslog forwarding, run the following command:
isi audit setting modify --syslog-forwarding-enabled false
To completely disable syslog forwarding and clear syslog servers, run the following command:
isi audit settings global modify --config-syslog-enabled=0 --clear-config-syslog-servers
isi audit settings global modify --system-syslog-enabled=0 --clear-system-syslog-servers
isi audit settings global modify --clear-protocol-syslog-serverss
Configure the vlagent loadbalancer IP address (e.g.,
172.16.107.1) for log delivery.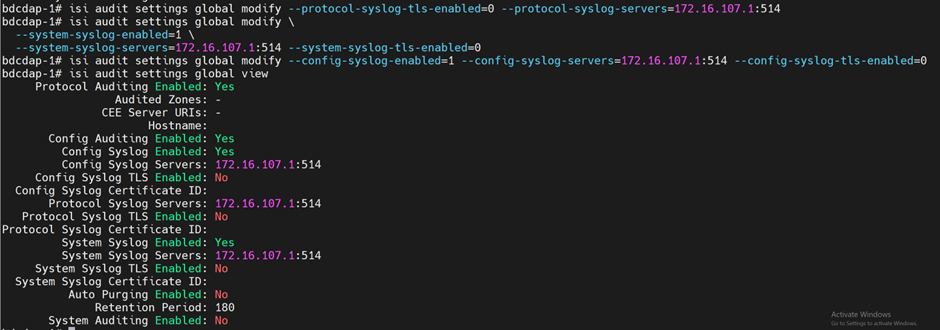
Procedure
Specify the following entries in the
software_config.json. For detailed information on updating thesoftware_config.json, see Input Parameters for Local Repositories.Note
The entry must be present when
telemetry_sources > powerscale > metrics_enabledis set totruein thetelemetry_config.ymlfile.{"name": "service_k8s", "version": "1.35.1", "arch": ["x86_64"]}, {"name": "csi_driver_powerscale", "version": "2.16.0", "arch": ["x86_64"]}
Configure the
omnia_config.yml:omnia_config.yml Variables
Mandatory/Optional
Details
cluster_nameMandatory
Type: String
Name of the cluster on which you want to deploy Kubernetes.
This input is case-sensitive. Do not add any special characters except
_(underscore) in the cluster name.
deploymentMandatory
Type: Boolean
Indicates if Kubernetes will be deployed or not.
Accepted values:
trueorfalse
k8s_cniMandatory
Type: String
Kubernetes SDN network.
Accepted values:
calicoDefault value:
calico
pod_external_ip_rangeMandatory
Type: String
These addresses will be used by the loadbalancer for assigning external IPs to Kubernetes services.
Ensure that the IP range provided is not assigned to any node in the cluster.
Ensure that the
pod_external_ip_rangedefined in theomnia_config.ymlfile is reachable from the OpenManage Enterprise appliance and the SFM network.Sample values:
172.16.107.170-172.16.107.200
k8s_service_addressesOptional
Type: String
Kubernetes internal network for services.
This network must be unused in your network infrastructure.
Default value:
"10.233.0.0/18"
k8s_pod_network_cidrOptional
Type: String
Kubernetes pod network CIDR for internal network. When used, it will assign IP addresses from this range to individual pods.
This network must be unused in your network infrastructure.
Default value:
"10.233.64.0/18"
csi_powerscale_driver_secret_file_pathOptional
Type: File path
If you want to deploy the CSI driver for PowerScale on your service cluster, add the file path of the
secrets.yamlfile to this variable.
csi_powerscale_driver_values_file_pathOptional
Type: File path
If you want to deploy the CSI driver for PowerScale on your service cluster, add the file path of the
values.yamlfile to this variable.
nfs_storage_nameMandatory
Type: String
Use same name as mentioned in each of the
nameavailable instorage_config.yml.
k8s_crio_storage_sizeMandatory
Type: String
Specifies the disk size allocated for CRI-O container storage.
etcd_on_local_diskOptional
Type: Boolean
Determines whether ETCD is deployed on local disk or NFS storage.
Accepted values:
trueorfalseDefault value:
falseWhen set to
true, ETCD is deployed on local disk on all master nodes. The system prioritizes BOSS card if available, and falls back to SSD/SATA disks if BOSS is not present. The/var/lib/etcddirectory is mounted on the selected local disk.When set to
falseor omitted, ETCD storage is provisioned using NFS, and no local disk configuration is performed for ETCD.Important: Migration from NFS to local disk is not supported during upgrades. This configuration is only applicable for fresh installations.
Ensure that the
telemetry_config.ymlhas the entries specific for PowerScale Telemetry deployment.Note
PowerScale Telemetry supports independent feature flags for metric collection and log collection. You can enable or disable each independently.
telemetry_config.yml Parameter
Mandatory/Optional
Details
telemetry_sources >
idrac>metrics_enabledMandatory
Type: Boolean
Enable or disable iDRAC metrics collection from Dell PowerEdge servers
Collected metrics: temperature, power, fan speed, storage health, CPU/memory errors
- Data path:
iDRAC Receiver -> ActiveMQ -> KafkaPump -> Kafka ‘idrac’ topic
iDRAC Receiver -> ActiveMQ -> VictoriaPump -> vmagent -> victoria_metrics
Accepted values:
trueorfalseDefault value:
true
Note
If iDRAC telemetry is enabled,
mysqldb_user,mysqldb_password, andmysqldb_root_passwordparameters in theomnia_config_credentials.ymlfile become mandatory.Note
If you want to deploy only Slurm clusters (
slurm_custom), setmetrics_enabledtofalse.telemetry_sources >
idrac>collection_targetsMandatory
Collection targets define where iDRAC data is sent before Vector processing
Supported values:
victoria_metrics,kafkaMultiple targets: Can specify both [
victoria_metrics,kafka]Default: [
victoria_metrics,kafka]
idrac_telemetry_configurations >
mysqldb_storageConditional Mandatory
MySQL database storage for iDRAC telemetry
Purpose: Storage configuration for iDRAC telemetry MySQL database
Accepted values: Must be specified in the form of
X[Ki|Mi|Gi|Ti|Pi|Ei]Default value:
1GiRequired when: telemetry_sources > idrac > metrics_enabled is true
telemetry_sources >
ldms>metrics_enabledMandatory
Type: Boolean
Enable or disable LDMS metrics collection from compute nodes
Collected metrics: CPU, memory, network, disk metrics
Data path: LDMS samplers → LDMS aggregator → store_avro_kafka → Kafka ‘ldms’ topic
Accepted values:
trueorfalseDefault value:
true
telemetry_sources >
ldms>collection_targetsMandatory
LDMS only supports Kafka collection (no direct victoria_metrics path)
Vector-LDMS bridge consumes from Kafka and routes to victoria_metrics
Supported values:
kafkaDefault: [
kafka]
telemetry_sources >
dcgm>metrics_enabledOptional
Type: Boolean
Enable or disable DCGM (NVIDIA Data Center GPU Manager) metrics collection
Collected metrics: GPU temperature, utilization, memory, ECC errors, power
Requires: NVIDIA GPU driver installed on compute nodes
Accepted values:
trueorfalseDefault value:
true
telemetry_sources >
powerscale>metrics_enabledOptional
Type: Boolean
Enable or disable PowerScale metrics collection from Dell PowerScale (OneFS) storage
Collected metrics: Storage metrics from Dell PowerScale clusters
Requires: CSM Observability (Karavi) values file configured
Data path: CSM Metrics PowerScale → OTEL Collector → vmagent(shared) → victoria_metrics
Accepted values:
trueorfalseDefault value:
true
telemetry_sources >
powerscale>logs_enabledOptional
Type: Boolean
Enable or disable PowerScale logs collection
Accepted values:
trueorfalseDefault value:
true
telemetry_sources >
powerscale>collection_targetsConditional Mandatory
PowerScale uses dedicated vmagent(shared) (no Kafka, no Vector)
Supported values:
victoria_metrics,victoria_logsDefault: [
victoria_metrics,victoria_logs]
telemetry_sources >
ufm>metrics_enabledOptional
Type: Boolean
Enable or disable UFM (NVIDIA UFM InfiniBand Fabric Manager) metrics collection
Collected metrics: IB port state, transmit/receive data, error counters, fabric topology
Requires: NVIDIA UFM appliance with Prometheus exporter enabled
Data path: UFM Prometheus Exporter → vmagent(shared) → victoria_metrics
Accepted values:
trueorfalseDefault value:
false
telemetry_sources >
ufm>logs_enabledOptional
Type: Boolean
Enable or disable UFM syslog logs collection
Accepted values:
trueorfalseDefault value:
false
telemetry_sources >
ufm>collection_targetsConditional Mandatory
UFM uses vmagent(shared) for metrics and VLAgent for logs
Supported values:
victoria_metrics,victoria_logsDefault: [
victoria_metrics,victoria_logs]
telemetry_sources >
vast>metrics_enabledOptional
Type: Boolean
Enable or disable VAST (Data Storage) metrics collection
Collected metrics: IB port state, transmit/receive data, error counters, fabric topology
Requires: VAST appliance with Prometheus exporter enabled
Data path: Prometheus Exporter → vmagent(shared) → victoria_metrics
Accepted values:
trueorfalseDefault value:
false
telemetry_sources >
vast>logs_enabledOptional
Type: Boolean
Enable or disable VAST syslog logs collection
Accepted values:
trueorfalseDefault value:
false
telemetry_sources >
vast>collection_targetsConditional Mandatory
VAST uses vmagent(shared) for metrics and VLAgent for logs
Supported values:
victoria_metrics,victoria_logsDefault: [
victoria_metrics,victoria_logs]
telemetry_bridges >
vector_ldms>metrics_enabledOptional
Type: Boolean
Enable or disable Vector-LDMS bridge (Kafka-to-victoria_metrics bridge for LDMS metrics)
Purpose: Consume LDMS metrics from Kafka ‘ldms’ topic, transform NERSC schema to Prometheus format, and write to victoria_metrics
Data flow: Kafka ‘ldms’ topic → Vector-LDMS → vmagent-vector → victoria_metrics
Requires: telemetry_sources > ldms > metrics_enabled = true
Accepted values:
trueorfalseDefault value:
true
telemetry_bridges >
vector_ome>metrics_enabledOptional
Type: Boolean
Enable or disable Vector-OME metrics routing (Kafka-to-Victoria bridge for OME metrics)
Data flow: Kafka ‘ome.*’ topics → Vector-OME → vmagent-vector (metrics)
Requires: OME to be configured with kafka
Accepted values:
trueorfalseDefault value:
true
telemetry_bridges >
vector_ome>logs_enabledOptional
Type: Boolean
Enable or disable Vector-OME logs routing
Data flow: Kafka ‘ome.*’ topics → Vector-OME → vlagent-vector (logs)
Accepted values:
trueorfalseDefault value:
true
telemetry_bridges >
vector_ome>ome_identifierOptional
Identifier used by Vector-OME for topic identification and routing
Internally used to match topics with the prefix (e.g.,
^ome\\..*$)Type: String
minLength: 1
Default value:
omeNote: Change only if your OME Kafka topics use a different prefix
telemetry_sinks >
victoria_metrics>persistence_sizeConditional Mandatory
Storage per vmstorage pod PVC
- Important: Total VictoriaMetrics storage depends on deployment mode:
Single-node mode: Total storage =persistence_size * 1 podCluster mode: Total storage =persistence_size * 3 vmstorage pods
Example (cluster):
8Gi * 3 = 24Gitotal VictoriaMetrics storageAccepted values: Must be specified in the form of
X[Ki|Mi|Gi|Ti|Pi|Ei]Default value:
8Gi(results in 24Gi total storage for cluster mode)
telemetry_sinks >
victoria_metrics>retention_periodConditional Mandatory
Metric retention period in hours
Default: 168 (7 days)
telemetry_sinks >
victoria_metrics>additional_metric_remote_write_endpointsOptional
Additional remote write endpoints for metrics (optional)
Purpose: Send metrics to external VictoriaMetrics instances in addition to Omnia-managed VictoriaMetrics
Format: List of endpoint objects with ‘url’ field (must start with http:// or https://)
TLS: Set ‘tls_insecure_skip_verify: true’ to skip TLS certificate verification
Default: [] (empty — only Omnia VictoriaMetrics receives metrics)
Example: - url: https://external-metrics-server:8480/insert/0/prometheus/api/v1/write
tls_insecure_skip_verify: false
telemetry_sinks >
victoria_logs>storage_sizeConditional Mandatory
Storage per vlstorage pod PVC
Total storage = storage_size × 3 vlstorage pods
Accepted values: Must be specified in the form of
X[Ki|Mi|Gi|Ti|Pi|Ei]Default value:
8Gi(results in 24Gi total storage)Sizing formula: (140 MB/day × retention_days × node_count) / 3 replicas
Warning
Storage under-provisioning can lead to data loss before the retention period is reached. Calculate storage requirements based on expected log volume and retention needs.
telemetry_sinks >
victoria_logs>retention_periodConditional Mandatory
Log retention period in hours
Type: Integer (hours)
Accepted values: 24-8760 (1 day to 1 year)
Default: 168 (7 days)
Note: Retention is global and applies to all log streams uniformly. Deletion occurs asynchronously during background merge operations.
Note
VictoriaLogs does not return an error when log entries with timestamps outside the configured retention window are submitted. Log entries will be automatically removed from VictoriaLogs after the retention period.
telemetry_sinks >
victoria_logs>additional_log_write_endpointsOptional
Additional remote write endpoints for logs (optional)
Purpose: Send logs to external VictoriaLogs instances in addition to Omnia-managed VictoriaLogs
Format: List of endpoint objects with ‘url’ field (must start with http:// or https://)
TLS: Set ‘tls_insecure_skip_verify: true’ to skip TLS certificate verification
Default: [] (empty — only Omnia VictoriaLogs receives logs)
Example: - url: https://external-logs-server:9481/internal/insert
tls_insecure_skip_verify: false
telemetry_sinks >
kafka>persistence_sizeConditional Mandatory
Storage per Kafka pod PVC
Total = persistence_size × 6 pods (3 brokers + 3 controllers)
Accepted values: Must be specified in the form of
X[Ki|Mi|Gi|Ti|Pi|Ei]Default value:
8Gi(results in 48Gi total storage)The default
8Gisize is suitable for small clusters (typically fewer than 5 nodes). For larger clusters, you should increase thepersistence_sizeand adjustlog_retention_hoursandlog_retention_bytesbased on expected data volume and cluster size.
Caution
Ensure that the Kafka broker settings
persistence_size,log_retention_hours, andlog_retention_bytesare configured based on your data retention requirements. If the persistent volume reaches its capacity before logs are deleted according to the log retention period configured, Kafka brokers may run out of disk space. For more details on managing Kafka log retention and cleanup policies, see Managing Kafka logs with delete and compact policies.telemetry_sinks >
kafka>log_retention_hoursConditional Mandatory
Log retention period in hours
Default: 168 (7 days)
telemetry_sinks >
kafka>log_retention_bytesConditional Mandatory
Maximum size of Kafka logs (in bytes) before deletion
Default: -1 (unlimited)
telemetry_sinks >
kafka>log_segment_bytesConditional Mandatory
Maximum size of Kafka log segments (in bytes)
Default: 1073741824 (1 GB)
telemetry_sinks >
kafka>topic_partitionsConditional Mandatory
Topic partitions per source (object format, not array)
Format: {topic_name: partition_count}
Required when: Source has kafka in collection_targets
Allowed topics:
idrac,ldmsonlyDefault partition counts:
idrac=1,ldms=2Example: {idrac: 1, ldms: 2}
ldms_configurations >
agg_portConditional Mandatory
Aggregator port on service K8s cluster
Valid range: 6001-6100
Default: 6001
ldms_configurations >
store_portConditional Mandatory
Store daemon port on service K8s cluster
The port can be the same as LDMS aggregator port
Valid range: 6001-6100
Default: 6001
ldms_configurations >
sampler_portConditional Mandatory
Sampler port on compute nodes
Valid range: 10001-10100
Default: 10001
ldms_configurations >
sampler_pluginsMandatory
Sampler plugins define which metrics to collect from compute nodes
- Parameters:
plugin_name: Name of the LDMS sampler plugin
config_parameters: Plugin-specific configuration (as a single string)
- activation_parameters: Collection schedule in MICROSECONDS
Format:
interval=<microseconds> offset=<microseconds>Example:interval=30000000(30 seconds)
- Default plugins:
meminfo: Memory usage statistics (free, used, buffers, cached)procstat2: Process statistics (CPU, memory, I/O per process)vmstat: Virtual memory statistics (paging, swapping, memory pressure)loadavg: System load average (1, 5, and 15 minute averages)procnetdev2: Network interface statistics (bytes, packets, errors, drops per interface)
Default activation_parameters:
interval=30000000(30 seconds for all plugins except procnetdev2 which includes offset=0)
powerscale_configurations >
otel_collector_storage_sizeConditional Mandatory
PVC size for OTEL Collector metric batching and buffering
Accepted values: Must be specified in the form of
X[Ki|Mi|Gi|Ti|Pi|Ei]Default value:
5Gi
powerscale_configurations >
csm_observability_values_file_pathConditional Mandatory
Path to the CSM Observability (Karavi Observability) values.yaml file
Required when: telemetry_sources > powerscale > metrics_enabled: true
Default value:
"
Note
In the values.yaml file, only set
karaviMetricsPowerscale -> enabled: true. Set the following parameters to false:karaviMetricsPowerflex -> enabled=false,karaviMetricsPowerstore -> enabled=false,karaviMetricsPowerscaleauthorization.-> enabled=false,karaviMetricsPowermax -> enabled=false.Note
Update the
isiAuthTypein the values.yaml file based on the current auth type setting. To check the current auth type setting, use the commandisi http settings view.Note
For CSI PowerScale health metrics, enable
controller > healthMonitor > enabled: trueandnode > healthMonitor > enabled: truein the CSI PowerScale values.yaml (https://raw.githubusercontent.com/dell/helm-charts/csi-isilon-2.15.0/charts/csi-isilon/values.yaml).ufm_configuration >
ufm_endpointConditional Mandatory
UFM appliance IP address or hostname
Required when: telemetry_sources > ufm > metrics_enabled is true
Example:
172.20.44.180orufm.example.comDefault value:
"
ufm_configuration >
ufm_metrics_portOptional
UFM Prometheus exporter port
Default value: 9001 (UFM default Prometheus port)
ufm_configuration >
scrape_intervalOptional
Prometheus scrape interval for UFM metrics
Accepted values: Prometheus duration format (e.g.,
15s,30s,1m)Default value:
30s
ufm_configuration >
scrape_timeoutOptional
Prometheus scrape timeout (must be <= scrape_interval)
Accepted values: Prometheus duration format (e.g.,
10s,15s)Default value:
15s
ufm_configuration >
tls_modeOptional
TLS mode for connecting to UFM Prometheus endpoint
Accepted values:
self_signed,ca_signedself_signed: Skip TLS verification (insecure_skip_verify=true)
ca_signed: Use CA certificate for TLS verification
Default value:
self_signed
ufm_configuration >
ufm_ca_cert_pathOptional
Path to CA certificate file for UFM TLS verification
Required when: tls_mode is
ca_signedMust be a valid PEM-format certificate file
Default value:
"(empty — not used when tls_mode isself_signed)
ufm_configuration >
auth_modeOptional
Authentication mode for UFM Prometheus endpoint
Accepted values:
basic,nonebasic: Use ufm_username/ufm_password from omnia_config_credentials.yml
none: No authentication (UFM endpoint is open)
Default value:
basic
vast_configuration >
vast_endpointConditional Mandatory
VAST appliance IP address or hostname
Required when: telemetry_sources > vast > metrics_enabled is true
Example:
172.20.44.180orvast.example.comDefault value:
"
vast_configuration >
vast_metrics_portOptional
VAST Prometheus exporter port
Default value: 9001 (VAST default Prometheus port)
vast_configuration >
scrape_intervalOptional
Prometheus scrape interval for VAST metrics
Accepted values: Prometheus duration format (e.g.,
15s,30s,1m)Default value:
30s
vast_configuration >
scrape_timeoutOptional
Prometheus scrape timeout (must be <= scrape_interval)
Accepted values: Prometheus duration format (e.g.,
10s,15s)Default value:
15s
vast_configuration >
tls_modeOptional
TLS mode for connecting to VAST Prometheus endpoint
Accepted values:
self_signed,ca_signedself_signed: Skip TLS verification (insecure_skip_verify=true)
ca_signed: Use CA certificate for TLS verification
Default value:
self_signed
vast_configuration >
vast_ca_cert_pathOptional
Path to CA certificate file for VAST TLS verification
Required when: tls_mode is
ca_signedMust be a valid PEM-format certificate file
Default value:
"(empty — not used when tls_mode isself_signed)
vast_configuration >
auth_modeOptional
Authentication mode for VAST Prometheus endpoint
Accepted values:
basic,nonebasic: Use vast_username/vast_password from omnia_config_credentials.yml
none: No authentication (VAST endpoint is open)
Default value:
basic
Configure PowerScale-specific parameters in
telemetry_config.yml:telemetry_sources > powerscale > metrics_enabled: Enable or disable PowerScale metric collection (
trueorfalse)telemetry_sources > powerscale > logs_enabled: Enable or disable PowerScale log collection (
trueorfalse)
Configure the CSM Observability values file:
Provide the path to the CSM Observability (Karavi Observability) values.yaml file in
telemetry_config.ymlImportant: In the values.yaml file, only set
karaviMetricsPowerscale -> enabled: true. Set the following parameters to false:karaviMetricsPowerflex -> enabled=false,karaviMetricsPowerstore -> enabled=false,karaviMetricsPowerscale.authorization -> enabled=false,karaviMetricsPowermax -> enabled=false.Health Metrics: For CSI PowerScale health metrics, enable
controller > healthMonitor -> enabled: trueandnode > healthMonitor -> enabled: truein the CSI PowerScale values.yaml (https://raw.githubusercontent.com/dell/helm-charts/csi-isilon-2.15.0/charts/csi-isilon/values.yaml).
Note
The karavi-metrics-powerscale pod may go into crashloopback state when CSM is enabled with Basic authentication. To check the current authentication type on PowerScale, run the following command:
isi http settings view
If Basic authentication is enabled, update the authentication type in the CSM Observability values.yaml file to use session-based authentication.
For dual-destination delivery (optional), configure an external observability endpoint:
Specify the external VictoriaMetrics endpoint in
telemetry_config.ymlMetrics will be delivered to both the internal time-series database and the external endpoint independently
Health Monitor Metrics
When the CSI PowerScale health monitor is enabled (controller > healthMonitor > enabled: true and node > healthMonitor > enabled: true in the CSI PowerScale values.yaml), Omnia collects the following additional health metrics:
PV Metrics:
powerscale_volume_status- PV phase (1=Bound, 0=Other) [pv_name, phase]powerscale_volume_count- Total PowerScale PVs by phase [phase]powerscale_volume_capacity_bytes- PV capacity in bytes [pv_name]powerscale_volume_info- PV metadata [pv_name, phase, storage_class, reclaim_policy, access_modes, volume_handle, pvc_name, pvc_namespace]powerscale_volume_age_seconds- Seconds since PV creation [pv_name]
PVC Metrics:
powerscale_pvc_status_phase- PVC phase (1=Bound, 0=Other) [pvc_name, pvc_namespace, phase]powerscale_pvc_requested_bytes- PVC requested storage in bytes [pvc_name, pvc_namespace]powerscale_pvc_count- Total PowerScale PVCs by phase [phase]
Health Event Metrics:
powerscale_volume_health_abnormal- Volume condition abnormal (1=abnormal, 0=healthy) [pvc_name, pvc_namespace, pv_name]powerscale_volume_abnormal_events_total- Total VolumeConditionAbnormal events [pvc_name, pvc_namespace]powerscale_node_failure_events_total- Total node failure events [node]
Node Metrics:
powerscale_node_ready- Node Ready condition (1=True, 0=False) [node]
Storage Class Metrics:
powerscale_storageclass_info- StorageClass metadata [storageclass, provisioner, reclaim_policy, volume_binding_mode, allow_volume_expansion]
Aggregate Summary:
powerscale_total_capacity_bytes- Total capacity of all PowerScale PVs in bytes
TLS and Authentication
All metric scraping uses TLS. Authentication uses Kubernetes service-account tokens. Mutual TLS (mTLS) is not required—the connection is encrypted but the PowerScale-side endpoint does not validate client identity via certificate exchange. TLS is enforced for all off-cluster communications.
Operational Health Monitoring
The PowerScale telemetry integration exposes operational health metrics including:
Scrape success rate
Scrape error count
Ingest latency
Log delivery error rate
These metrics are available for alerting and monitoring via the same observability stack. The OpenTelemetry Collector endpoint maintains availability exceeding 98% over a 24-hour period.
Feature Constraints
Supports a single PowerScale cluster per Omnia deployment
Omnia-orchestrated mode requires CSI Driver for Dell PowerScale and cert-manager to be installed on the service Kubernetes cluster
Mutual TLS is not required on the metrics exporter endpoint; transport is encrypted but client identity is not verified via certificate exchange
Syslog integration requires network connectivity between the PowerScale cluster and the Omnia log agent
The metric set is aligned with Dell CSM Metrics capabilities; metrics not exposed by CSM Metrics are not available
Performance Requirements
Key PowerScale metrics appear in the time-series database within one scrape interval of emission
Syslog events arrive in the log database with less than 1-minute end-to-end latency under nominal load
OpenTelemetry Collector endpoint availability exceeds 98% over a 24-hour period
Scrape interval is configurable between 30 and 60 seconds
Enable and Disable PowerScale Telemetry
You can enable or disable PowerScale telemetry using the following commands:
To disable PowerScale telemetry:
ansible-playbook telemetry/telemetry_disable.yml --tags powerscale
After disabling PowerScale telemetry, to enable PowerScale telemetry again:
ansible-playbook telemetry/telemetry_enable.yml --tags powerscale
Note
Set
powerscale.metrics_enabledtotrueorfalsein thetelemetry_config.ymlfile.The
powerscaletag is mandatory to perform the action.
Enable and Disable PowerScale Logs
You can enable or disable PowerScale logs using the following commands:
To disable PowerScale logs, run the following commands:
isi audit settings global modify --config-syslog-enabled=0 --clear-config-syslog-servers
isi audit settings global modify --system-syslog-enabled=0 --clear-system-syslog-servers
isi audit settings global modify --clear-protocol-syslog-servers
isi audit setting modify --syslog-forwarding-enabled false
After disabling PowerScale logs, to enable PowerScale logs again, run the following commands:
isi audit setting modify --syslog-forwarding-enabled true
isi audit settings global modify --config-syslog-enabled=1 --config-syslog-servers=<vlagent loadbalancer ip>:514 --config-syslog-tls-enabled=0
isi audit settings global modify --protocol-syslog-servers=<vlagent loadbalancer ip>:514 --protocol-syslog-tls-enabled=0
isi audit settings global modify --system-syslog-enabled=1 --system-syslog-servers=<vlagent loadbalancer ip>:514 --system-syslog-tls-enabled=0
If you have any feedback about Omnia documentation, please reach out at omnia.readme@dell.com.