Integrate NVIDIA Unified Fabric Manager (UFM) with Omnia Telemetry for Secure Metrics and Logs Streaming
This section describes how to configure NVIDIA Unified Fabric Manager (UFM) to securely stream telemetry metrics and logs to the Service Kubernetes cluster.
This procedure assumes that VictoriaMetrics is deployed in cluster mode in the
telemetry namespace of the Service Kubernetes cluster.
For more information, see the VictoriaMetrics cluster mode documentation.
Using Omnia, you can deploy UFM Telemetry to collect InfiniBand fabric performance metrics and syslog events from NVIDIA Unified Fabric Manager (UFM) appliances. The deployment includes configuring the UFM Telemetry components on the service Kubernetes cluster, integrating with the UFM Prometheus exporter via vmagent, and ingesting syslog events via the VLAgent pipeline.
UFM Telemetry collects InfiniBand fabric metrics and logs. UFM Telemetry includes these components:
UFM Prometheus Exporter: Exposes InfiniBand fabric metrics on a Prometheus-compatible HTTPS endpoint (default port 9001).
vmagent (shared): Scrapes the UFM Prometheus exporter endpoint over TLS and forwards metrics to VictoriaMetrics.
VMServiceScrape CR: Kubernetes custom resource that declares the UFM scrape target for the VictoriaMetrics operator.
VLAgent: Receives UFM syslog events (RFC 3164/5424) and forwards them to VictoriaLogs.
Kubernetes Service + Endpoints: Abstracts the external UFM appliance as a discoverable Kubernetes service for vmagent.
Supported Metrics and Logs
Metrics:
The UFM metrics include the following:
Port State: InfiniBand port operational state (up, down, disabled)
Traffic Counters: Transmit/receive data rates (bytes/sec), packet counts per port
Error Counters: Symbol errors, link error recovery, link downed, VL15 dropped, excessive buffer overrun errors
Fabric Topology: Switch information, port mapping, node GUIDs, LID assignments
Telemetry Health: Scrape success rate, scrape duration, ingest latency
Logs:
The UFM logs include the following:
Fabric topology change events, port state transitions, error/warning messages
SM (Subnet Manager) events, SHARP events, UFM health events
Events are labeled with hostname, severity, and facility
Prerequisites
Make sure the following prerequisites are met:
Ensure that the
provision.ymlplaybook has been executed successfully withservice_kube_control_planeandservice_kube_nodein the mapping file.Ensure the service Kubernetes cluster has sufficient resources to run vmagent (shared instance) and VLAgent.
Ensure network connectivity between the service Kubernetes cluster and the NVIDIA UFM appliance.
Ensure that the
telemetry_config.ymlhas the entries specific for UFM Telemetry deployment enabled. For more details on configuringtelemetry_config.yml, see Service Cluster Telemetry Configuration.
Note
UFM Telemetry supports independent feature flags for metric collection and log collection. You can enable or disable each independently. For more details, see Configure Deployment Required for iDRAC Telemetry Service.
For UFM metrics collection, configure the following settings on the UFM appliance:
The UFM Prometheus exporter must be enabled and accessible from the service cluster.
Enable UFM Telemetry: Ensure UFM Telemetry is enabled in the
gv.cfgconfiguration file:[Telemetry] telemetry_provider = telemetry
Verify Prometheus endpoint: Confirm that the UFM Prometheus exporter is accessible at
https://<ufm_ip>:9001/metrics.Configure SSL certificates (optional): If using CA-signed TLS, set up SSL and CA certificates in UFM. For detailed steps, see Setting Up SSL and CA Certificates in UFM - Optional Configurations.
For UFM log collection, configure the following settings on the UFM appliance:
Enable syslog forwarding using the UFM Web UI:
Configure using the UFM Web UI to send syslog messages to the VLAgent LoadBalancer IP:
From the left navigation menu, select Settings → Data Streaming
Select System log and complete the fields:
Destination: Enter the VLAgent LoadBalancer IP address
Syslog Port: Enter 514 (default)
System logs Level: Select syslog level from the dropdown based on your requirements
Streaming Data: Select UFM logs
Click Save
Enable syslog forwarding using the UFM CLI:
Configure using the UFM CLI to send syslog messages to the VLAgent LoadBalancer IP. Modify the
[Logging]section in/opt/ufm/conf/gv.cfg:[Logging] syslog = true syslog_addr = <external vlagent loadbalancer IP>:514 ufm_syslog = true event_syslog = true syslog_level = WARNING
For detailed information on UFM syslog configuration parameters, see NVIDIA UFM Enterprise User Manual - Configuring Syslog.
Set VLAgent LoadBalancer IP: Configure the VLAgent LoadBalancer IP address for syslog delivery. Retrieve the VLAgent external IP from the service Kubernetes cluster:
kubectl get svc -n telemetry | grep vlagent
Verify UFM Telemetry Flow
This section outlines the steps to verify UFM telemetry data in VictoriaMetrics.
View Collected UFM Telemetry Data using VictoriaMetrics UI (VMUI) - Cluster Mode Deployment
After applying the telemetry.yml configuration using the VictoriaMetrics deployment mode as cluster,
use the (VMUI) to validate that UFM telemetry data is being collected and stored
successfully in a cluster mode VictoriaMetrics deployment. For more details, see
VictoriaMetrics Cluster deployment documentation.
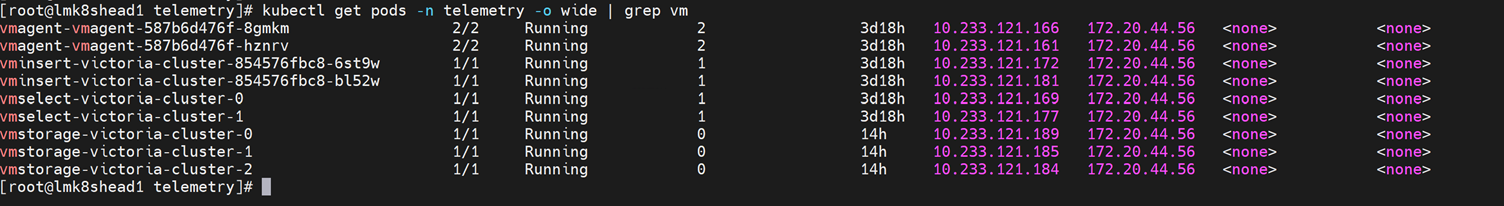
Run the following command to verify that the VictoriaMetrics pod is running:
kubectl get pods -n telemetry -o wide | grep vm
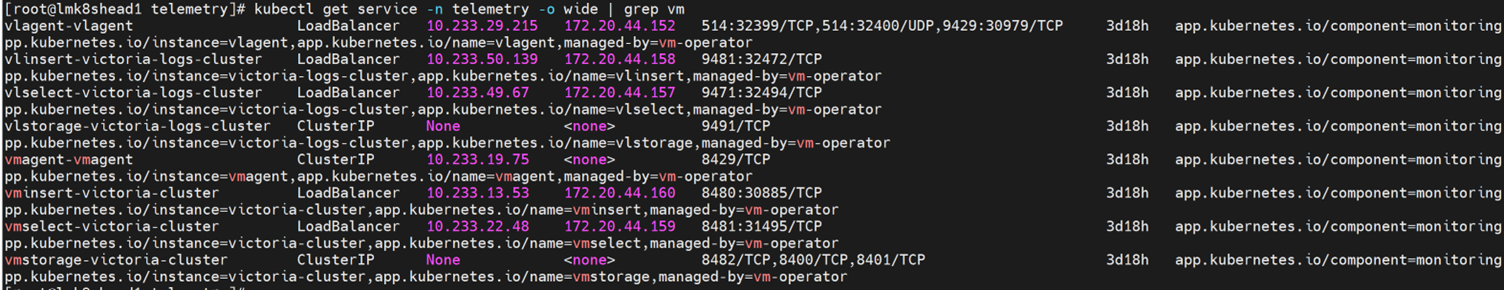
Run the following command to verify that the VictoriaMetrics service is running:
kubectl get service -n telemetry -o wide | grep vm
Run the following command to verify VMagent logs for UFM scraping to view recent logs:
VMAGENT_POD=$(kubectl get pods -n telemetry -l app.kubernetes.io/name=vmagent -o jsonpath='{.items[0].metadata.name}')
kubectl logs $VMAGENT_POD -n telemetry -c vmagent --tail=50

Note the External IP and port number of the VictoriaMetrics service. The external IP and port number will be used to access the VictoriaMetrics UI (VMUI):
kubectl get svc -n telemetry | grep vmselect

Access the VMUI in a web browser using:
``https://<external vmselect loadbalancer IP>:8481/select/vmui``
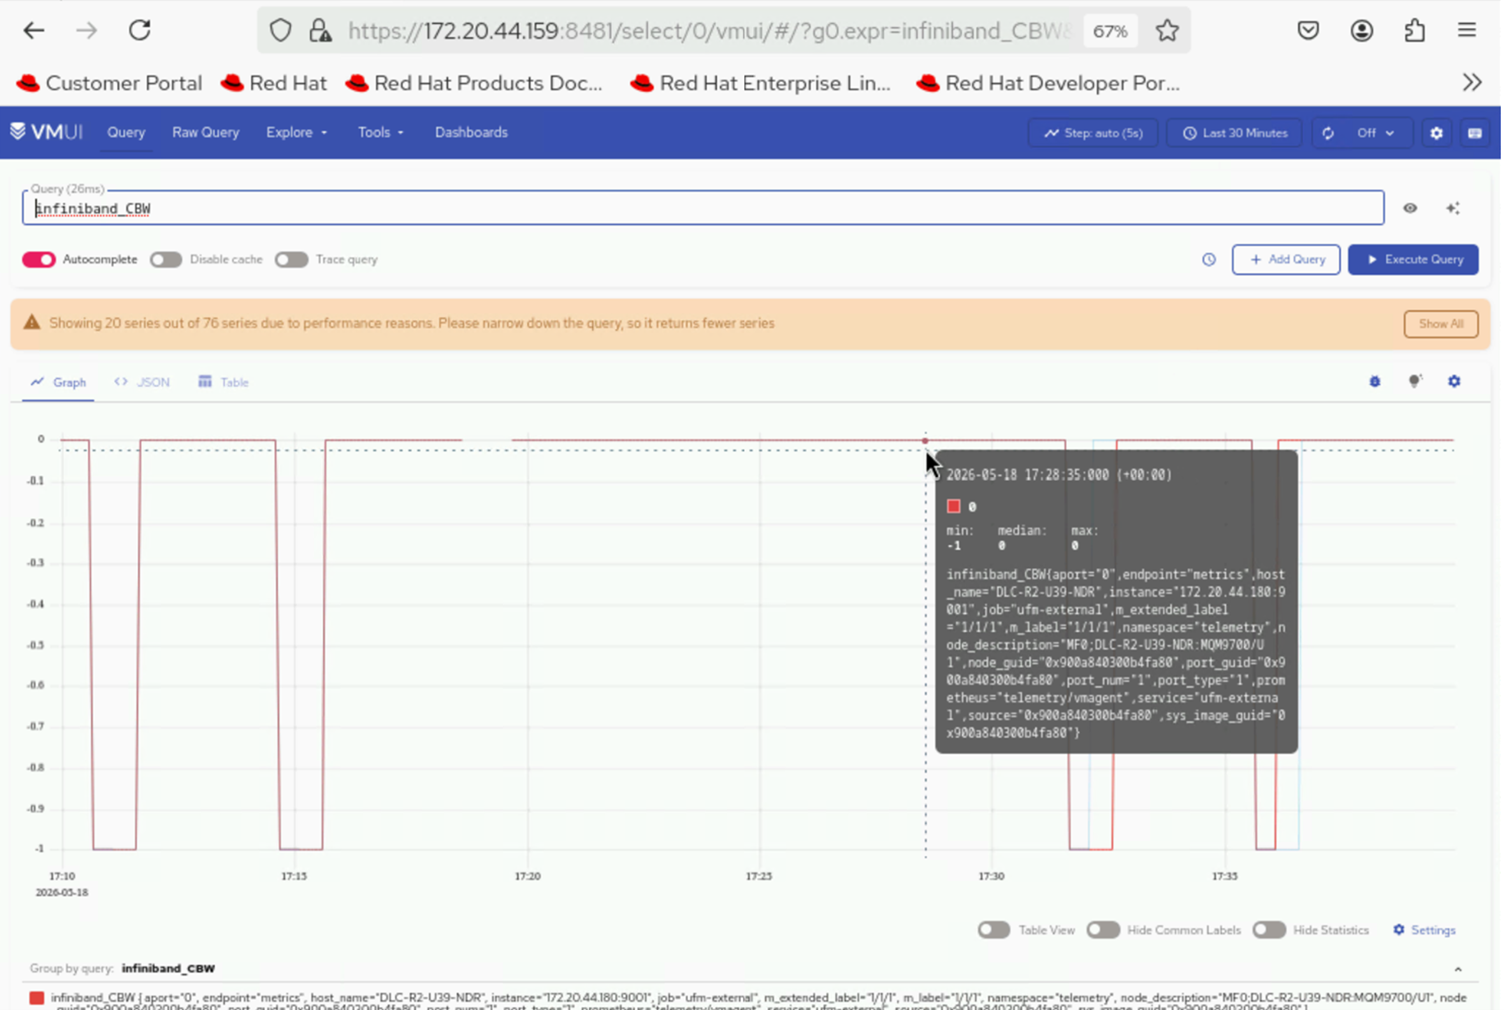
6. Filter and view UFM InfiniBand metrics using queries in VMUI. For example, the following query displays UFM InfiniBand metrics:
{source="ufm", subsystem="infiniband"}
Key UFM Metrics
Metric Name |
Description |
Unit |
|---|---|---|
Metric Name |
Description |
Unit |
ib_port_state |
InfiniBand port operational state (1=down, 2=init, 3=armed, 4=active) |
state |
ib_port_xmit_data |
Transmitted data per port |
bytes |
ib_port_rcv_data |
Received data per port |
bytes |
ib_port_xmit_pkts |
Transmitted packets per port |
packets |
ib_port_rcv_pkts |
Received packets per port |
packets |
ib_port_symbol_error |
Symbol error count per port |
count |
ib_port_link_error_recovery |
Link error recovery count per port |
count |
ib_port_link_downed |
Link downed count per port |
count |
ib_port_rcv_errors |
Received errors per port |
count |
ib_port_vl15_dropped |
VL15 dropped packets per port |
packets |
ib_excessive_buffer_overrun_errors |
Excessive buffer overrun error count per port |
count |
View UFM Logs using VictoriaLogs
Configure the VLAgent LoadBalancer IP address for syslog delivery. Retrieve the VLAgent LoadBalancer IP and configure it on the UFM appliance by following the steps outlined in the prerequisites section above:
kubectl get svc -n telemetry | grep -E "(vlagent|victoria-logs)"

Retrieve the external IP and port of the vlselect service:
kubectl get svc -n telemetry | grep vlselect

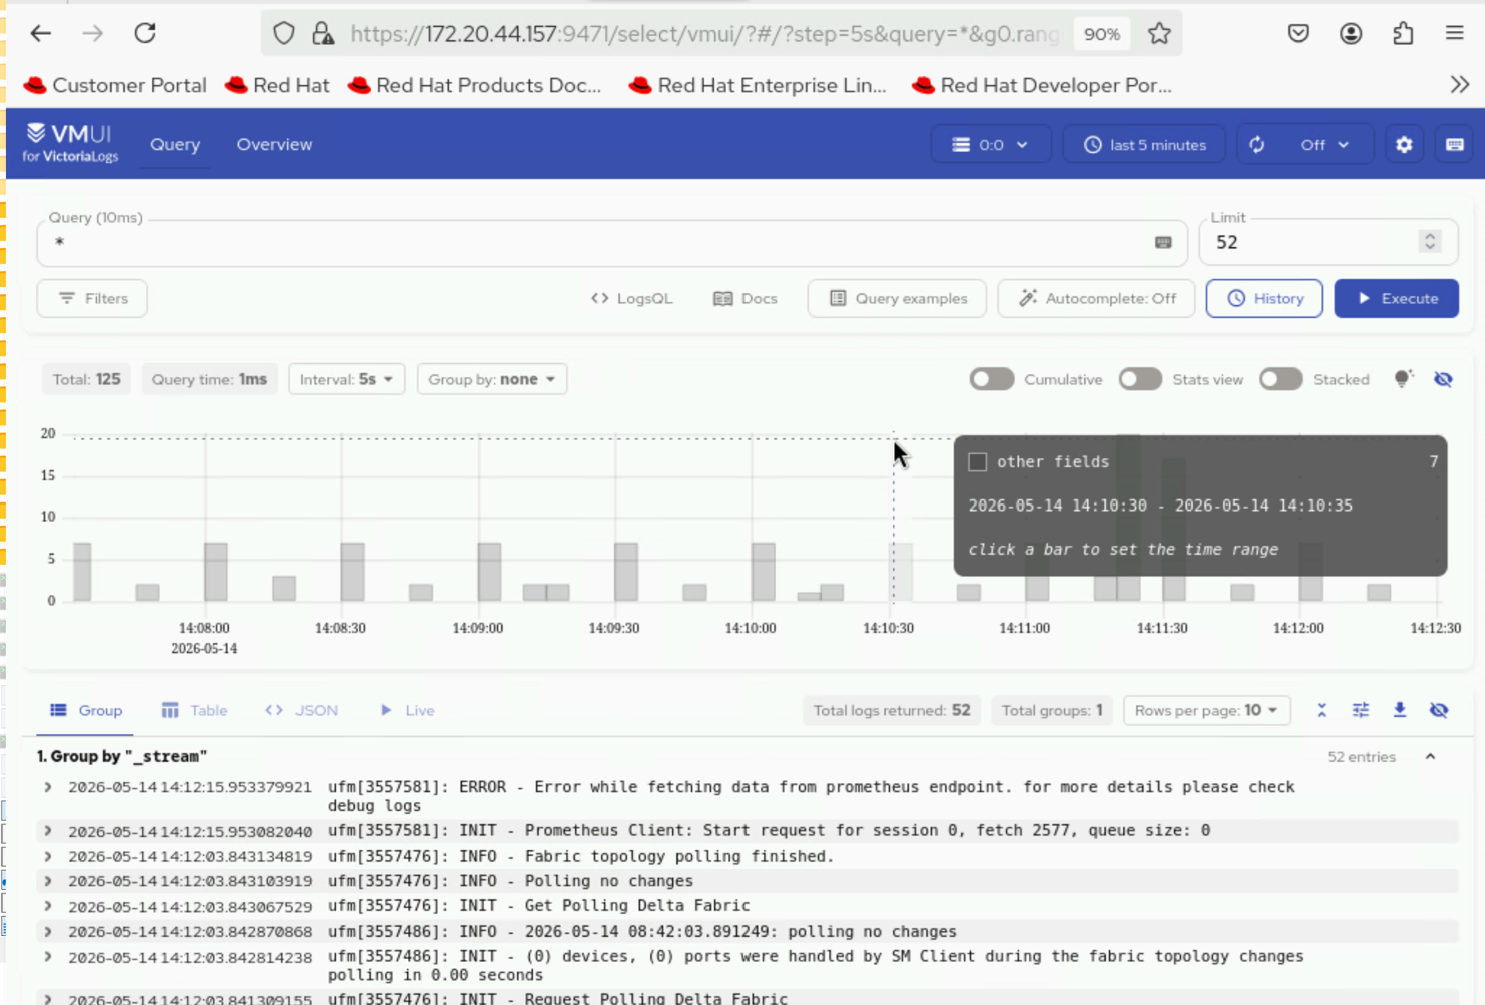
Access the VMUI in a web browser using:
``https://<external vlselect loadbalancer IP>:9471/select/0/vmui``
If you have any feedback about Omnia documentation, please reach out at omnia.readme@dell.com.