Troubleshooting guide
Troubleshooting Core Container Failures
The deployment of the Omnia core container may fail for the following reasons:
The
omnia.shscript aborts early.podman pullfails.The Omnia core container starts but cannot write to the shared path.
Resolution:
Peform the following steps:
Verify the Omnia core container status using the following command:
podman ps --format 'table {{.Names}}\t{{.Status}}'
Review Omnia core container logs using the following command:
podman logs -n 200 omnia_core
Verify time synchronization on the OIM. TLS communication between Omnia containers depends on accurate time synchronization.
Use the following commands to check time synchronization status:
timedatectl status
chronyc tracking || chronyc sources -v
If time drift is detected, enable Chrony or NTP and re-synchronize time before proceeding.
Ensure that the OIM hostname meets the following requirements. If not, rename the host to comply with the hostname rules and re-run the
omnia.shscript.
No dot (
.), underscore (_), or comma (,)No leading or trailing hyphen (
-)No uppercase characters
Must not start with a digit
Fully qualified domain name (FQDN) length must be ≤ 64 characters
Check whether Podman is installed and able to pull images. If not, install podman and verify podman login.
Verify outbound network connectivity from the OIM.
Validate the NFS shared path and SELinux context. To fix any issues related to NFS, export the NFS share with
no_root_squashenabled, ensure the shared path has 755 permissions, and bind the shared path with SELinux relabeling.
podman run --rm -v /shared:/mnt:z registry.access.redhat.com/ubi10/ubi sh -lc 'touch /mnt/.rw'
If unsure, start with a local shared path and switch to NFS later.
8. After applying the fixes, re-run the omnia.sh script to deploy the Omnia core
container.
Troubleshooting failures during prepare OIM
The prepare OIM playbook may fail for the following reasons:
Certificate or TLS failures
Expected container not created
Service is running but unreachable
Resolution
Verify container inventory:
podman ps --format 'table {{.Names}}\t{{.Image}}\t{{.Status}}'
Common Container Logs and Debugging Shortcuts
Use the following commands to troubleshoot container issues across Omnia services.
To view list of all Omnia containers, run the following command:
podman ps -a
To view container logs, run the following command:
podman logs -n 200 <container>
To test outbound connectivity from a container, run the following command:
podman exec -it <container> sh -lc 'curl -I https://example.com'
PXE Boot Hangs During Node Replacement
When an existing node is replaced with a new node and discovery.yml is rerun, the new node may hang during PXE boot at nm-wait-online-initrd.service.
Cause: An IP address conflict occurs when the new node is assigned an IP address that is still in use by the old node on the network.
Resolution: Before adding the new node, complete the following steps:
Ensure the old node is powered off or disconnected from the network.
Verify that the IP address is not in use by any other device.
Rerun
discovery.ymlafter confirming that no IP conflicts exist.
Checking and updating encrypted parameters
Move to the file path where the parameters are saved (as an example, we will be using
omnia_config_credentials.yml):cd /opt/omnia/input/project_default/
To view the encrypted parameters:
ansible-vault view omnia_config_credentials.yml --vault-password-file .omnia_config_credentials_key
To edit the encrypted parameters:
ansible-vault edit omnia_config_credentials.yml --vault-password-file .omnia_config_credentials_key
Checking podman container status from the OIM
Use this command to get a list of all running podman conatiners:
podman psCheck the status of any specific podman containers:
podman ps -f name=<container_name>
Packages download issues during local_repo.yml playbook execution
The
local_repo.ymlplaybook generates and provides log files as part of its execution. For example, if the local repository is partially unsuccessful for nfs, analyze the issue using the following steps:
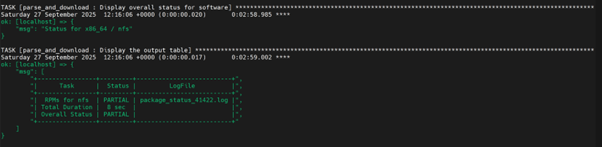
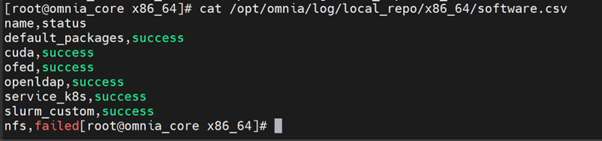
To view the overall download status of all software in the .csv format, run the following command:
opt/omnia/log/local_repo/<arch>/software.csv
Example:
/opt/omnia/log/local_repo/x86_64/software.csv
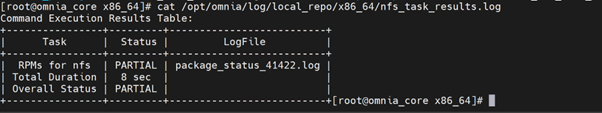
To view the overall download status of all packages and the log filenames for a specific software, run the following command:
/opt/omnia/log/local_repo/<sw>_task_results.log
Example: For nfs:
/opt/omnia/log/local_repo/x86_64/nfs_task_results.log
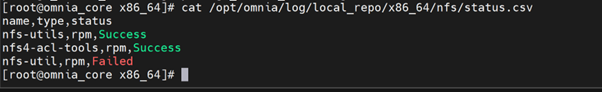
To view the package level status, run the following command:
/opt/omnia/log/local_repo/x86_64/<sw>/status.csv
Example:
/opt/omnia/log/local_repo/x86_64/nfs/status.csv
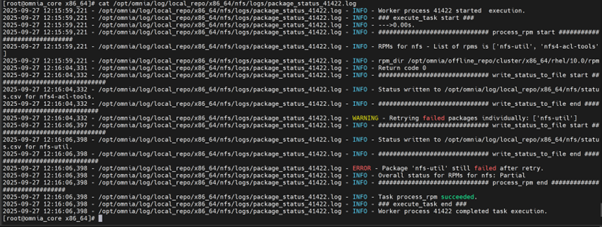
To view the issues information and the reason for job being unsuccessful, see the
package_status_<pid>.logfile mentioned in the<sw>_task_result.log.
Example:
/opt/omnia/log/local_repo/x86_64/nfs/logs/package_status_41422.log
Troubleshooting logs
For more information, see Logs.
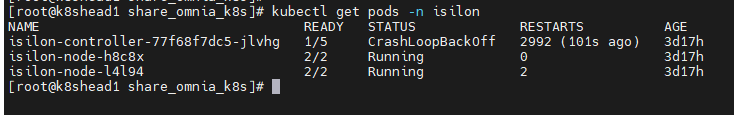
Troubleshooting PowerScale isilon pods after node reboot
Why is the PowerScale (Isilon) CSI controller pod in CrashLoopBackOff after a node reboot, and how can it be resolved?
Resolution: Do the following:
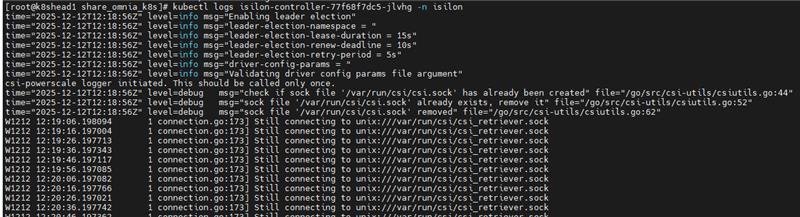
Inspect recent logs from the controller deployment:
kubectl logs deploy/isilon-controller -n isilon --all-containers=true | tail -n 60
Restart the Isilon controller deployment:
kubectl rollout restart deployment isilon-controller -n isilon
Restart the Isilon node daemonset:
kubectl rollout restart daemonset isilon-node -n isilon
These actions ensure that any components affected by the reboot are recreated properly and resume normal operation.
Troubleshooting LDMS on the slurm nodes
Check the ldms aggregator and ldms store logs.
kubectl logs -n telemetry nersc-ldms-aggr-0
kubectl logs -n telemetry nersc-ldms-store-slurm-cluster-0
SSH to the slurm node from where the LDMS metrics are not retrieved.
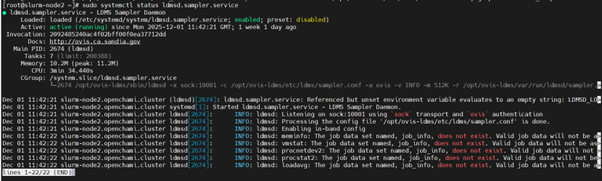
Run
sudo systemctl status ldmsd.sampler.serviceand check ldmsd service is running on the slurm nodes.
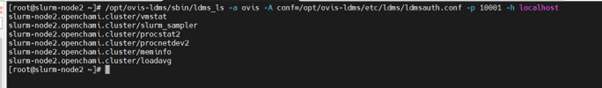
If the ldmsd daemon is running, check whether supported plugins are loaded using the following command:
/opt/ovis-ldms/sbin/ldms_ls -a ovis -A conf=/opt/ovis-ldms/etc/ldms/ldmsauth.conf -p 10001 -h localhost
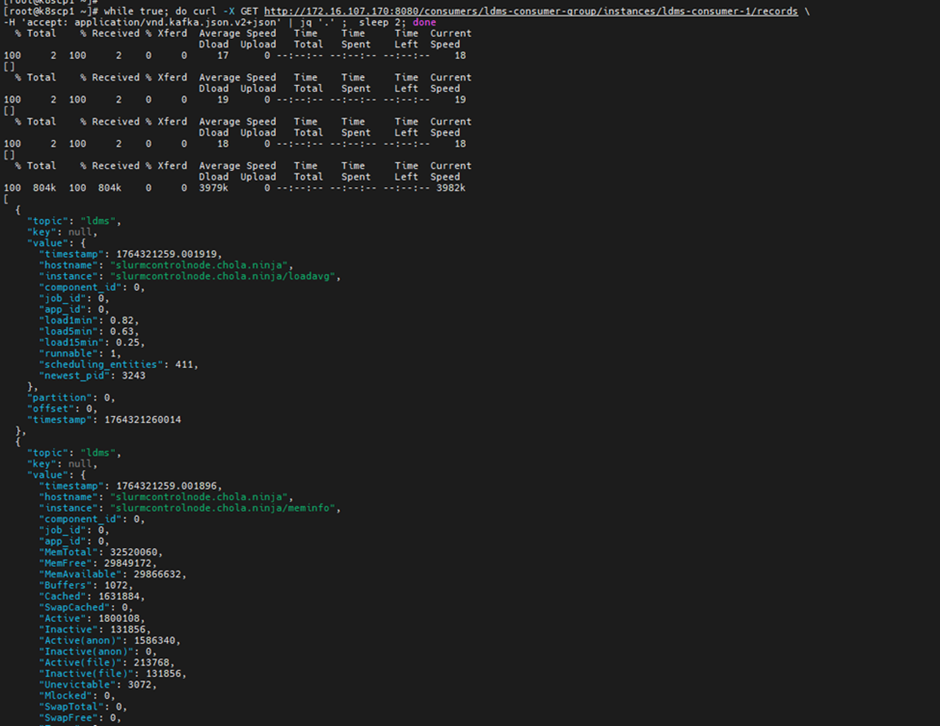
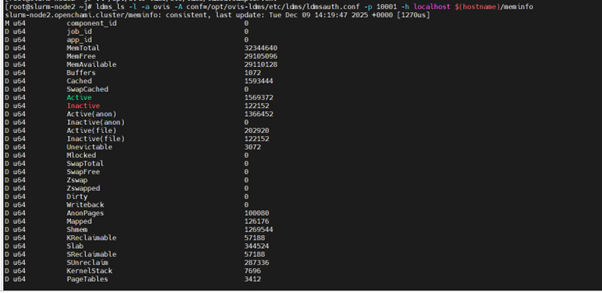
If ldms plugins are loaded, check the metrics of each plugin using the following command:
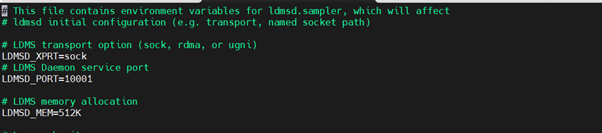
Get the ldsm_port from the file /opt/ovis-ldms/etc/ldms/ldmsd.sampler.env and run the following command:
ldms_ls -l -a ovis -A conf=/opt/ovis-ldms/etc/ldms/ldmsauth.conf -p <ldms_port> -h localhost $(hostname)/<plugin_name>
Example:
ldms_ls -l -a ovis -A conf=/opt/ovis-ldms/etc/ldms/ldmsauth.conf -p 10001 -h localhost $(hostname)/meminfo
Pulp Repository Sync and Publication Failures
No Space Left on NFS Share (where Pulp is mounted).
Cause: Pulp storage runs out of disk space during sync or publish. In this case , Pulp logs show the error “No space left on device.” Check the available storage space on the NFS share.
Resolution: Increase the size of the NFS share where Pulp is mounted to free up space.
Incorrect URL in
local_repo_config.yml.
Cause: The repository URLs in the local_repo_config.yml file may be incorrect . The URL must point to the repository root (where the repodata directory exists) and be reachable.
Resolution: Verify and update the URLs in the local_repo_config.yml file to ensure they are correct and accessible.
NFS storage configuration or performance
Cause: If Pulp is mounted on NFS, network delays can impact performance, potentially causing sync or publication issues.
Resolution: Reduce PULP_SYNC_CONCURRENCY and PULP_PUBLISH_CONCURRENCY to 1 in config.py.
Location:
vi  common/library/module_utils/local_repo/config.py
PULP_SYNC_CONCURRENCY =  1
PULP_PUBLISH_CONCURRENCY = 1
Re-run Failed Operations: After making the changes, re-run the Ansible playbook to retry the failed operations:
ansible-playbook local_repo.yml.
After job submission on the Slurm cluster, compute nodes intermittently enter the DRAINED state
When Slurm nodes go into a DRAINED state after job submission, one possible cause is a failure in an epilog script under /etc/slurm/epilog.d due to incorrect file permissions.
To resolve, ensure the epilog script is executable on all Slurm nodes.
For example:
chmod 0755 /etc/slurm/epilog.d/logout_user.sh
After updating the permissions, reload the Slurm configuration:
scontrol reconfigure
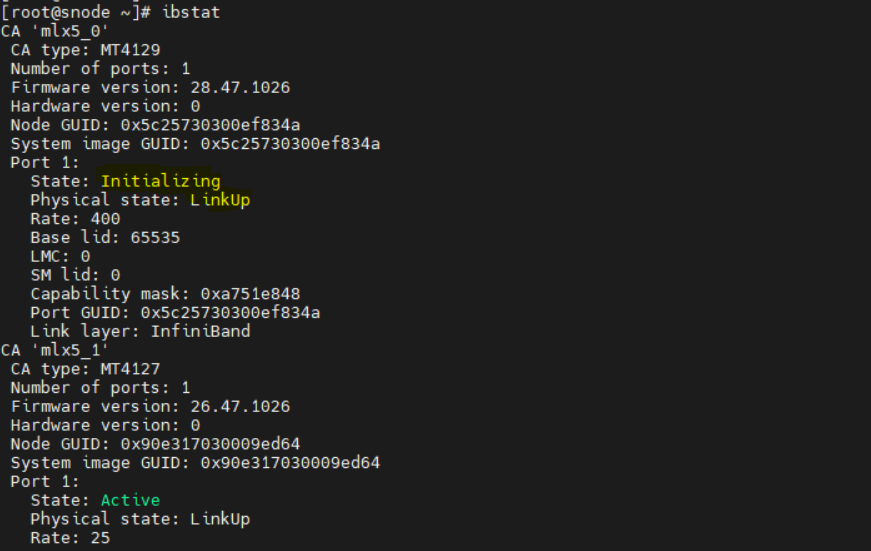
InfiniBand ports remain in initializing state on hosts
In Omnia deployments using InfiniBand (IB) networking, compute or management hosts show InfiniBand ports stuck in the Initializing state after boot. Even though the physical link is up, InfiniBand communication between nodes does not work. Running the following command on the host shows the port state as Initializing:
ibstat
Cause:
The Open Subnet Manager (OpenSM) service is not running on the InfiniBand (IB) switch. Subnet Manager is a fabric‑level service that should be running on the IB switch. If OpenSM is not enabled on the IB switch, the InfiniBand fabric cannot complete initialization, causing host ports to remain in the Initializing state.
Resolution:
Ensure that the Open Subnet Manager service is enabled and running on the InfiniBand switch.
After enabling OpenSM on the IB switch, do the following:
PXE boot all the IB NIC based nodes.
Run the following command on the host: ibstat
Verify that the InfiniBand ports state transition to:
State: Active
Slow nvidia-smi response on GPU compute nodes
On GPU compute nodes, the nvidia-smi command may take several seconds to minutes to return output, particularly after a reboot or fresh NVIDIA driver installation.
Cause:
On some GPU compute nodes, the NVIDIA driver may intermittently behave slowly during normal runtime operation. This slow behavior is observed when GPU persistence mode is not enabled, causing delayed responses from GPU management commands such as nvidia-smi.
Resolution:
Enable GPU persistence mode so that the NVIDIA driver keeps GPUs initialized even when idle. This prevents repeated GPU reinitialization and ensures nvidia-smi responds immediately.
To enable Persistence Mode, run the following command on the GPU node:
nvidia-smi -pm 1
To verify that persistence mode is enabled:
sudo nvidia-smi -q | grep "Persistence Mode"
Expected output should show Persistence Mode as Enabled:

GPU GRES configuration failures on Slurm nodes
GPU jobs fail to submit when requesting GPU resources using –gres=gpu:<count>. The submission fails with:
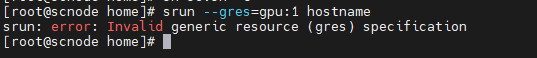
This occurs because GPU nodes are missing the Gres= configuration in /etc/slurm/slurm.conf (shows as Gres=null or not present).
Cause
The Redfish API used to get the GPU count for Slurm nodes is returning GPU count as zero. As a result, slurm.conf is not updated with the GPU count for each Slurm node.
Resolution
Note
Ensure there is network connectivity to all specified BMC IP addresses before executing the script.
Incorrect BMC credentials results in authentication failures. All the BMC credentials must be the same.
Login to omnia core container.
ssh to Slurm controller.
Copy the provided script content and save it with the following filename:
gpu_detect.shEdit the script and update the BMC credentials with the exact username and password for your environment. Locate and update the following variables inside the script.
BMC_USERNAME=<your_bmc_username>
BMC_PASSWORD=<your_bmc_password>
#!/bin/bash
set -euo pipefail

SLURM_CONF="/etc/slurm/slurm.conf"
LOG="/tmp/gpu_detection.log"

BMC_USERNAME="****"
BMC_PASSWORD="****"

[[ $EUID -eq 0 ]] || { echo "Run as root"; exit 1; }
for b in curl jq awk sed grep; do command -v "$b" >/dev/null || exit 1; done
[[ -f "$SLURM_CONF" ]] || { echo "slurm.conf not found"; exit 1; }

echo "# GPU Detection $(date)" > "$LOG"

# ---------------- GPU DETECTION ----------------
detect_gpus() {
        local ip="$1"

        curl -ksu "$BMC_USERNAME:$BMC_PASSWORD" \
                "https://$ip/redfish/v1/" >/dev/null || { echo 0; return; }

        curl -ksu "$BMC_USERNAME:$BMC_PASSWORD" \
                "https://$ip/redfish/v1/Chassis/System.Embedded.1/PCIeDevices" |
        jq -r '.Members[]?.["@odata.id"]' |
        while read -r dev; do
                curl -ksu "$BMC_USERNAME:$BMC_PASSWORD" "https://$ip$dev"
        done |
        jq -r '
        select(
                (
                        (.ClassCode=="0x0300" or .ClassCode=="0x0302") and
                        (.VendorId=="0x10de" or .VendorId=="0x1002")
                )
                or
                (
                        (.Manufacturer // "" | test("NVIDIA|AMD"; "i")) and
                        (.Name // "" | test("GPU|RTX|TESLA|A100|H100|L40|GB"; "i"))
                )
        ) | .Name
        ' | wc -l
}

# ---------------- NODE UPDATE ----------------
update_node() {
        local node="$1" gpus="$2"

        local match
        match=$(grep -n "^NodeName=.*\b$node\b" "$SLURM_CONF" || true)
        [[ -z "$match" || "$match" =~ \[ ]] && return 1

        local ln=${match%%:*}
        local orig
        orig=$(sed -n "${ln}p" "$SLURM_CONF")

        local new
        new=$(echo "$orig" | sed -E 's/[[:space:]]+Gres=[^[:space:]]+//g')
        new="$new Gres=gpu:$gpus"

        awk -v l="$ln" -v r="$new" 'NR==l{$0=r}1' \
                "$SLURM_CONF" > "$SLURM_CONF.tmp"
        mv "$SLURM_CONF.tmp" "$SLURM_CONF"
}

# ---------------- GLOBAL CONFIG ----------------
ensure_globals() {

# Ensure SelectType
if grep -q "^SelectType=" "$SLURM_CONF"; then
        sed -i 's/^SelectType=.*/SelectType=select\/cons_tres/' "$SLURM_CONF"
else
        echo "SelectType=select/cons_tres" >> "$SLURM_CONF"
fi

# Ensure GresTypes near SelectType
if grep -q "^GresTypes=" "$SLURM_CONF"; then
        if ! grep -q "^GresTypes=.*\bgpu\b" "$SLURM_CONF"; then
        sed -i 's/^GresTypes=\(.*\)/GresTypes=\1,gpu/' "$SLURM_CONF"
        fi
else
        awk '
        {
        print
        if ($0 ~ /^SelectType=select\/cons_tres/) {
                print "GresTypes=gpu"
        }
        }' "$SLURM_CONF" > "$SLURM_CONF.tmp" && mv "$SLURM_CONF.tmp" "$SLURM_CONF"
fi
}

# ---------------- MAIN ----------------
updated=0

for arg in "$@"; do
        [[ "$arg" =~ : ]] || continue
        ip="${arg%:*}"
        node="${arg#*:}"

        gpus=$(detect_gpus "$ip")
        [[ "$gpus" -eq 0 ]] && continue

        echo "$(date): $node ($ip) -> $gpus GPUs" >> "$LOG"

        if update_node "$node" "$gpus"; then
                updated=1
        fi
done

if [[ $updated -eq 1 ]]; then
        ensure_globals
        echo "✔ slurm.conf updated correctly"
        echo "✔ GresTypes placed after SelectType"
        echo "✔ NO reload applied"
else
        echo "No GPUs detected or no nodes updated"
fi

echo "Log: $LOG"
Run the following command to make the script executable:
chmod +x gpu_detect.sh
To run the script on a single node, use the following format:
./gpu_detect.sh <bmc_ip>:<node_name>
Example:
./gpu_detect.sh 192.168.1.10:node0
To run the script on multiple nodes, specify multiple
<ip>:<node_name>pairs separated by spaces./gpu_detect.sh <bmc_ip1>:<node_name1> <bmc_ip2>:<node_name2>
Example:
./gpu_detect.sh 192.168.1.10:node01 192.168.1.11:node02
To verify the GPU count, run the following command on the Slurm controller. If any node is in the INVALID or DRAIN state, the following commands must be executed on the Slurm controller node by changing the
node_name:scontrol update NodeName=<node_name> State=DOWN Reason="stuck completing" scontrol reconfigure scontrol update NodeName=<node_name> State=RESUME
If you have any feedback about Omnia documentation, please reach out at omnia.readme@dell.com.