Step 16: Verify Telemetry Services Deployed on the Cluster
This section outlines the steps to validate telemetry services and their components, including checking pod status, verifying message flow, confirming TLS connectivity, and reviewing collected telemetry data.
Note
For the list of iDRAC telemetry metrics collected by Kafka and VictoriaMetrics, see iDRAC Telemetry Reference Tools.
Verify Telemetry-Related Pods Are Running
To verify that the iDRAC Telemetry, Kafka, LDMS, and VictoriaMetrics pods are running, do the following:
Run the following command:
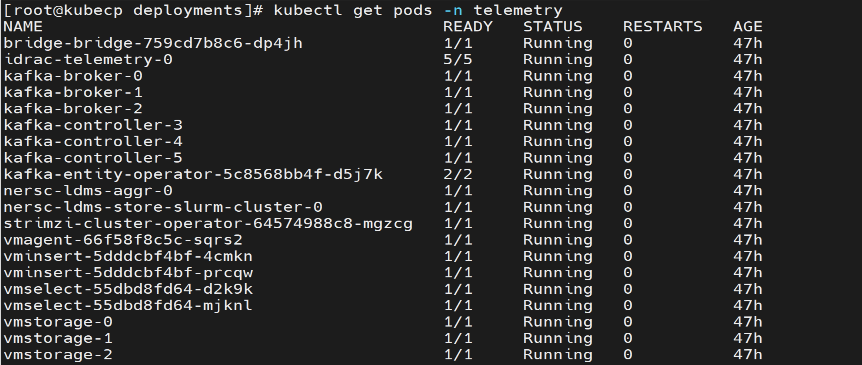
kubectl get pods -n telemetry
Ensure that the following pods are in a running state in the output:
iDRAC Telemetry pods
Kafka broker, controller, and operator pods
LDMS aggregator and store pods
VictoriaMetrics and vmagent pods
The following is the sample output file:
Verify Kubernetes Telemetry Services Attached to Telemetry
To verify Kubernetes telemetry services attached to the iDRAC Telemetry, Kafka, LDMS, and VictoriaMetrics pods, do the following:
Run the following command:
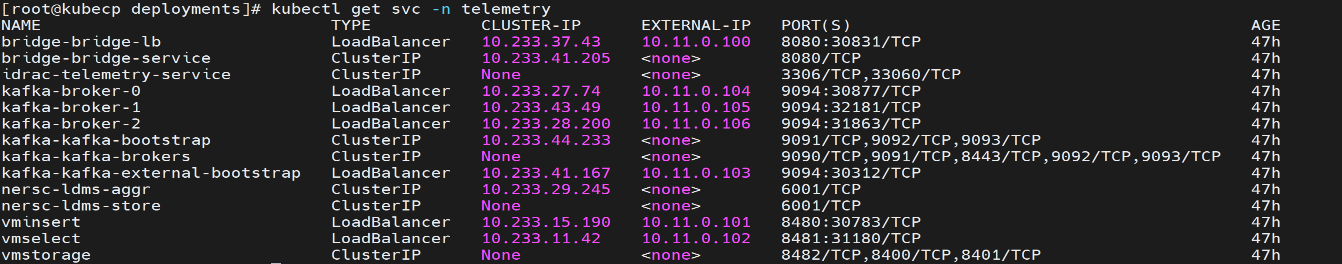
kubectl get svc -n telemetry
Ensure the following service entries exist:
iDRAC Telemetry service
Kafka broker, controller, and bridge services
LDMS aggregator and store services
VictoriaMetrics service
The following is the sample output file:
Verify iDRAC Telemetry Messages in Kafka
To verify that iDRAC telemetry data is being successfully published to the idrac Kafka topic, do the following:
Create a Kafka consumer using the following command:
KAFKA_LB_IP=<external load balancer IP of the bridge-bridge-lb service>
curl -X POST http://$KAFKA_LB_IP:8080/consumers/idrac-consumer-group \
-H 'content-type: application/vnd.kafka.v2+json' \
-d '{
        "name": "idrac-consumer-1",
        "format": "json",
        "auto.offset.reset": "earliest"
    }'
Subscribe the consumer to the telemetry topic using the following command:
curl -X POST http://$KAFKA_LB_IP:8080/consumers/idrac-consumer-group/instances/idrac-consumer-1/subscription \
-H 'content-type: application/vnd.kafka.v2+json' \
-d '{"topics": ["idrac"]}'
Consume messages from the topic using the following command:
while true; do curl -X GET http://$KAFKA_LB_IP:8080/consumers/idrac-consumer-group/instances/idrac-consumer-1/records \
-H 'accept: application/vnd.kafka.json.v2+json' | jq '.' ;  sleep 2; done
If telemetry metrics are collected correctly, the output contains JSON-formatted iDRAC telemetry records.
Verify LDMS Messages in Kafka
To verify that LDMS telemetry data is being successfully published to the ldms Kafka topic, do the following:
Create a Kafka consumer using the following command:
KAFKA_LB_IP=<external load balancer IP of the bridge-bridge-lb service>
curl -X POST http://$KAFKA_LB_IP:8080/consumers/ldms-consumer-group \
-H 'content-type: application/vnd.kafka.v2+json' \
-d '{
        "name": "ldms-consumer-1",
        "format": "json",
        "auto.offset.reset": "earliest",
        "enable.auto.commit": true
    }'
Subscribe the consumer to the LDMS topic using the following command:
curl -X POST http://$KAFKA_LB_IP:8080/consumers/ldms-consumer-group/instances/ldms-consumer-1/subscription \
-H 'content-type: application/vnd.kafka.v2+json' \
-d '{"topics": ["ldms"]}'
Consume messages from the topic using the following command:
while true; do curl -X GET http://$KAFKA_LB_IP:8080/consumers/ldms-consumer-group/instances/ldms-consumer-1/records \
-H 'accept: application/vnd.kafka.json.v2+json' | jq '.' ;  sleep 2; done
If telemetry is flowing correctly, the output contains JSON-formatted LDMS telemetry records.
Verify Kafka TLS Connectivity
To verify TLS connectivity for Kafka, run the Kafka TLS test job to verify that certificates, truststores, keystores, and mTLS communication are functioning correctly:
cd /<nfs client mount path of the service k8s cluster>/telemetry/deployments/test
kubectl apply -f kafka.tls_test_job.yaml
After the job completes, check the logs to confirm that the TLS connection is successful:
kubectl logs kafka-tls-test-xxx -n telemetry
Verify VictoriaMetrics TLS Connectivity
To verify TLS connectivity for VictoriaMetrics, run the VictoriaMetrics TLS test job to verify that certificates and secure connectivity are functioning correctly:
cd /<nfs client mount path of the service k8s cluster>/telemetry/deployments/test
kubectl apply -f victoria-tls-test-job.yaml
After the job completes, check the logs to confirm that the TLS connection is successful:
kubectl logs victoria-tls-test-xxx -n telemetry
View Collected iDRAC Telemetry Data using VictoriaMetrics UI (VMUI) - Single Mode Deployment
After applying the telemetry.yml configuration using the VictoriaMetrics deployment mode as single-node,
use the (VMUI) to validate that iDRAC telemetry data is being collected and stored
successfully in a single-mode VictoriaMetrics deployment. For more details, see
VictoriaMetrics Single Server documentation.
Note
Metric availability depends on the server hardware configuration and iDRAC capabilities. Only telemetry metrics that are exposed and streamed by iDRAC can be retrieved and viewed. Metrics that appear as “NA” (Not Available) in iDRAC are not included in telemetry data and therefore do not appear in telemetry queries or views.
Run the following command to verify that the VictoriaMetrics pod is running:
kubectl get pods -n telemetry -o wide -l app=victoriametrics

Run the following command to verify that the VictoriaMetrics service is running:
kubectl get service -n telemetry -o wide -l app=victoriametrics

Note the External IP and port number of the VictoriaMetrics service. The external IP and port number will be used to access the VictoriaMetrics UI (VMUI).
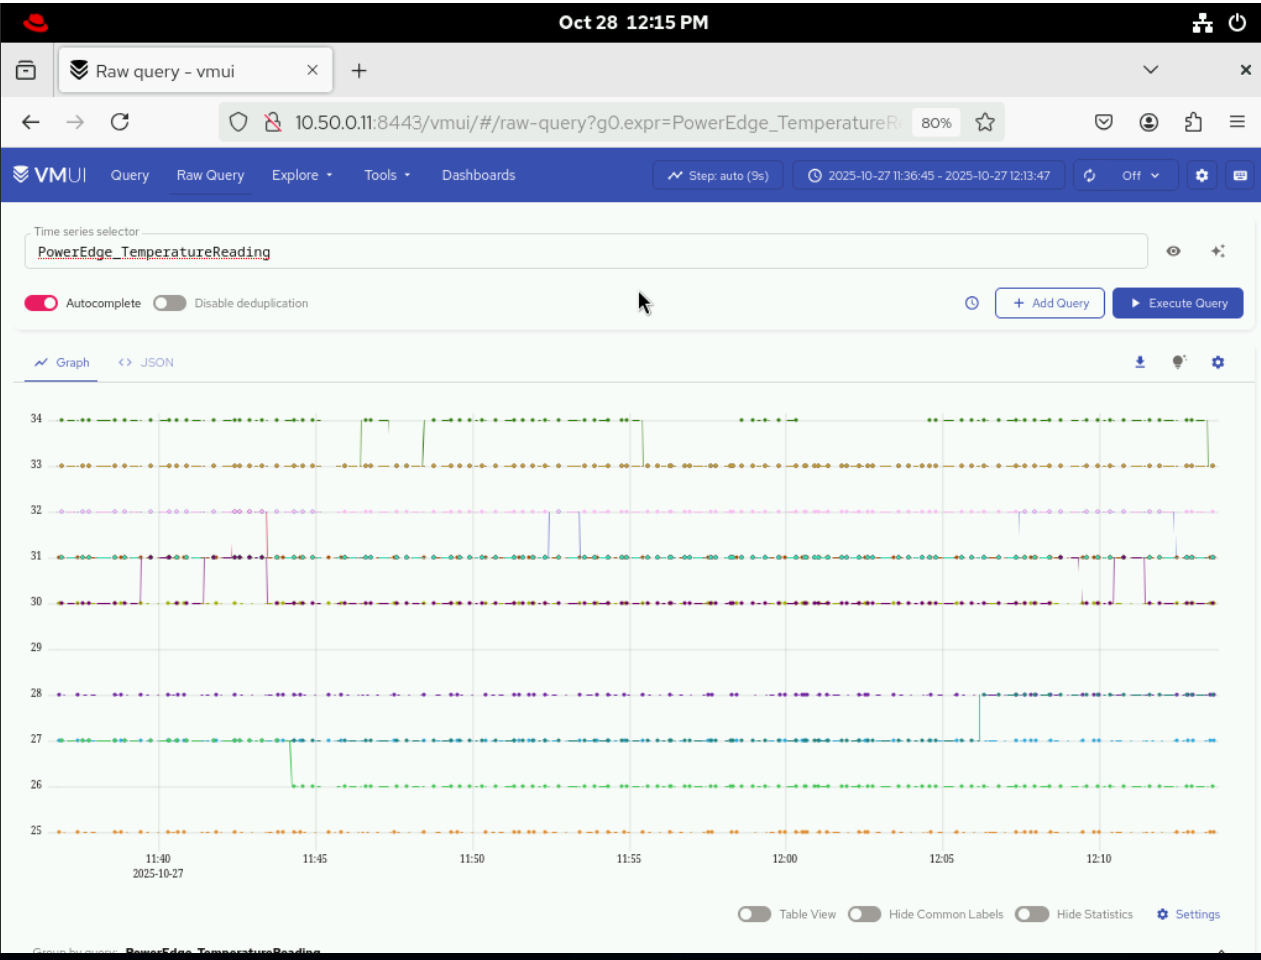
Access the VMUI in a web browser using:
http://<external victoria metrics loadbalancer IP>:8443/vmui
5. Filter and view telemetry metrics using queries in VMUI. For example, the following query displays detailed temperature readings for each hardware component:
{name="PowerEdge_TemperatureReading", FQDD!=""}
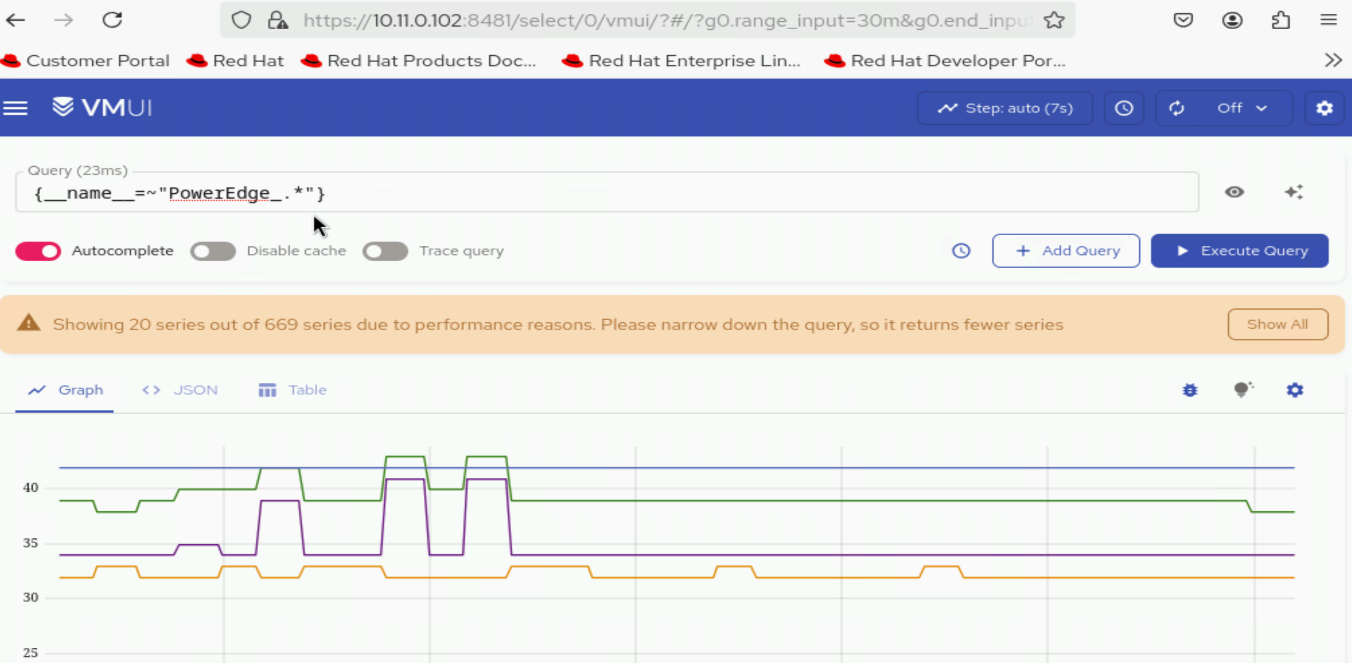
View Collected iDRAC Telemetry Data using VictoriaMetrics UI (VMUI) - Cluster Mode Deployment
After applying the telemetry.yml configuration using the VictoriaMetrics deployment mode as cluster,
use the (VMUI) to validate that iDRAC telemetry data is being collected and stored
successfully in a cluster mode VictoriaMetrics deployment. For more details, see
VictoriaMetrics Cluster deployment documentation.
Run the following command to verify that the VictoriaMetrics pod is running:
kubectl get pods -n telemetry -o wide | grep vm
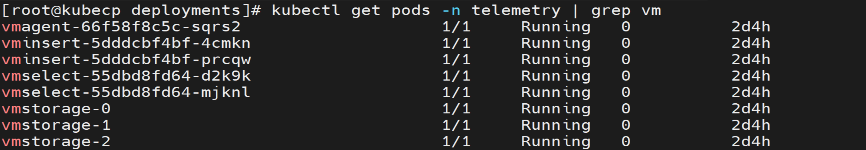
Run the following command to verify that the VictoriaMetrics service is running:
kubectl get service -n telemetry -o wide | grep vm

Note the External IP and port number of the VictoriaMetrics service. The external IP and port number will be used to access the VictoriaMetrics UI (VMUI).
Access the VMUI in a web browser using:
https://<external vmselect loadbalancer IP>:8481/select/0/vmui
5. Filter and view telemetry metrics using queries in VMUI. For example, the following query displays detailed PowerEdge metrics for each hardware component:
{__name__=~"PowerEdge_.*"}
Accessing the MySQL Database
After telemetry.yml has been executed for the service cluster, you can check the MySQL Database database inside the mysqldb container. To view these logs, do the following:
Use the following command to get the names of all the telemetry pods:
kubectl get pods -n telemetry -l app=idrac-telemetryNote
The
idrac-telemetry-0pod will always be responsible for collecting the telemetry data of the management nodes (oim,service_kube_control_plane_x86_64,service_kube_node_x86_64,login_node_x86_64, etc.).
Execute the following command:
kubectl exec -it -n telemetry <iDRAC_telemetry_pod_name> -c mysqldb -- mysql -u <MYSQL_USER> -pWhen prompted, enter the mysql password to log in.
To enter into the
idrac_telemetry_db, use the following command:use idrac_telemetrydb;To access the services table:
select * from services;
If you have any feedback about Omnia documentation, please reach out at omnia.readme@dell.com.